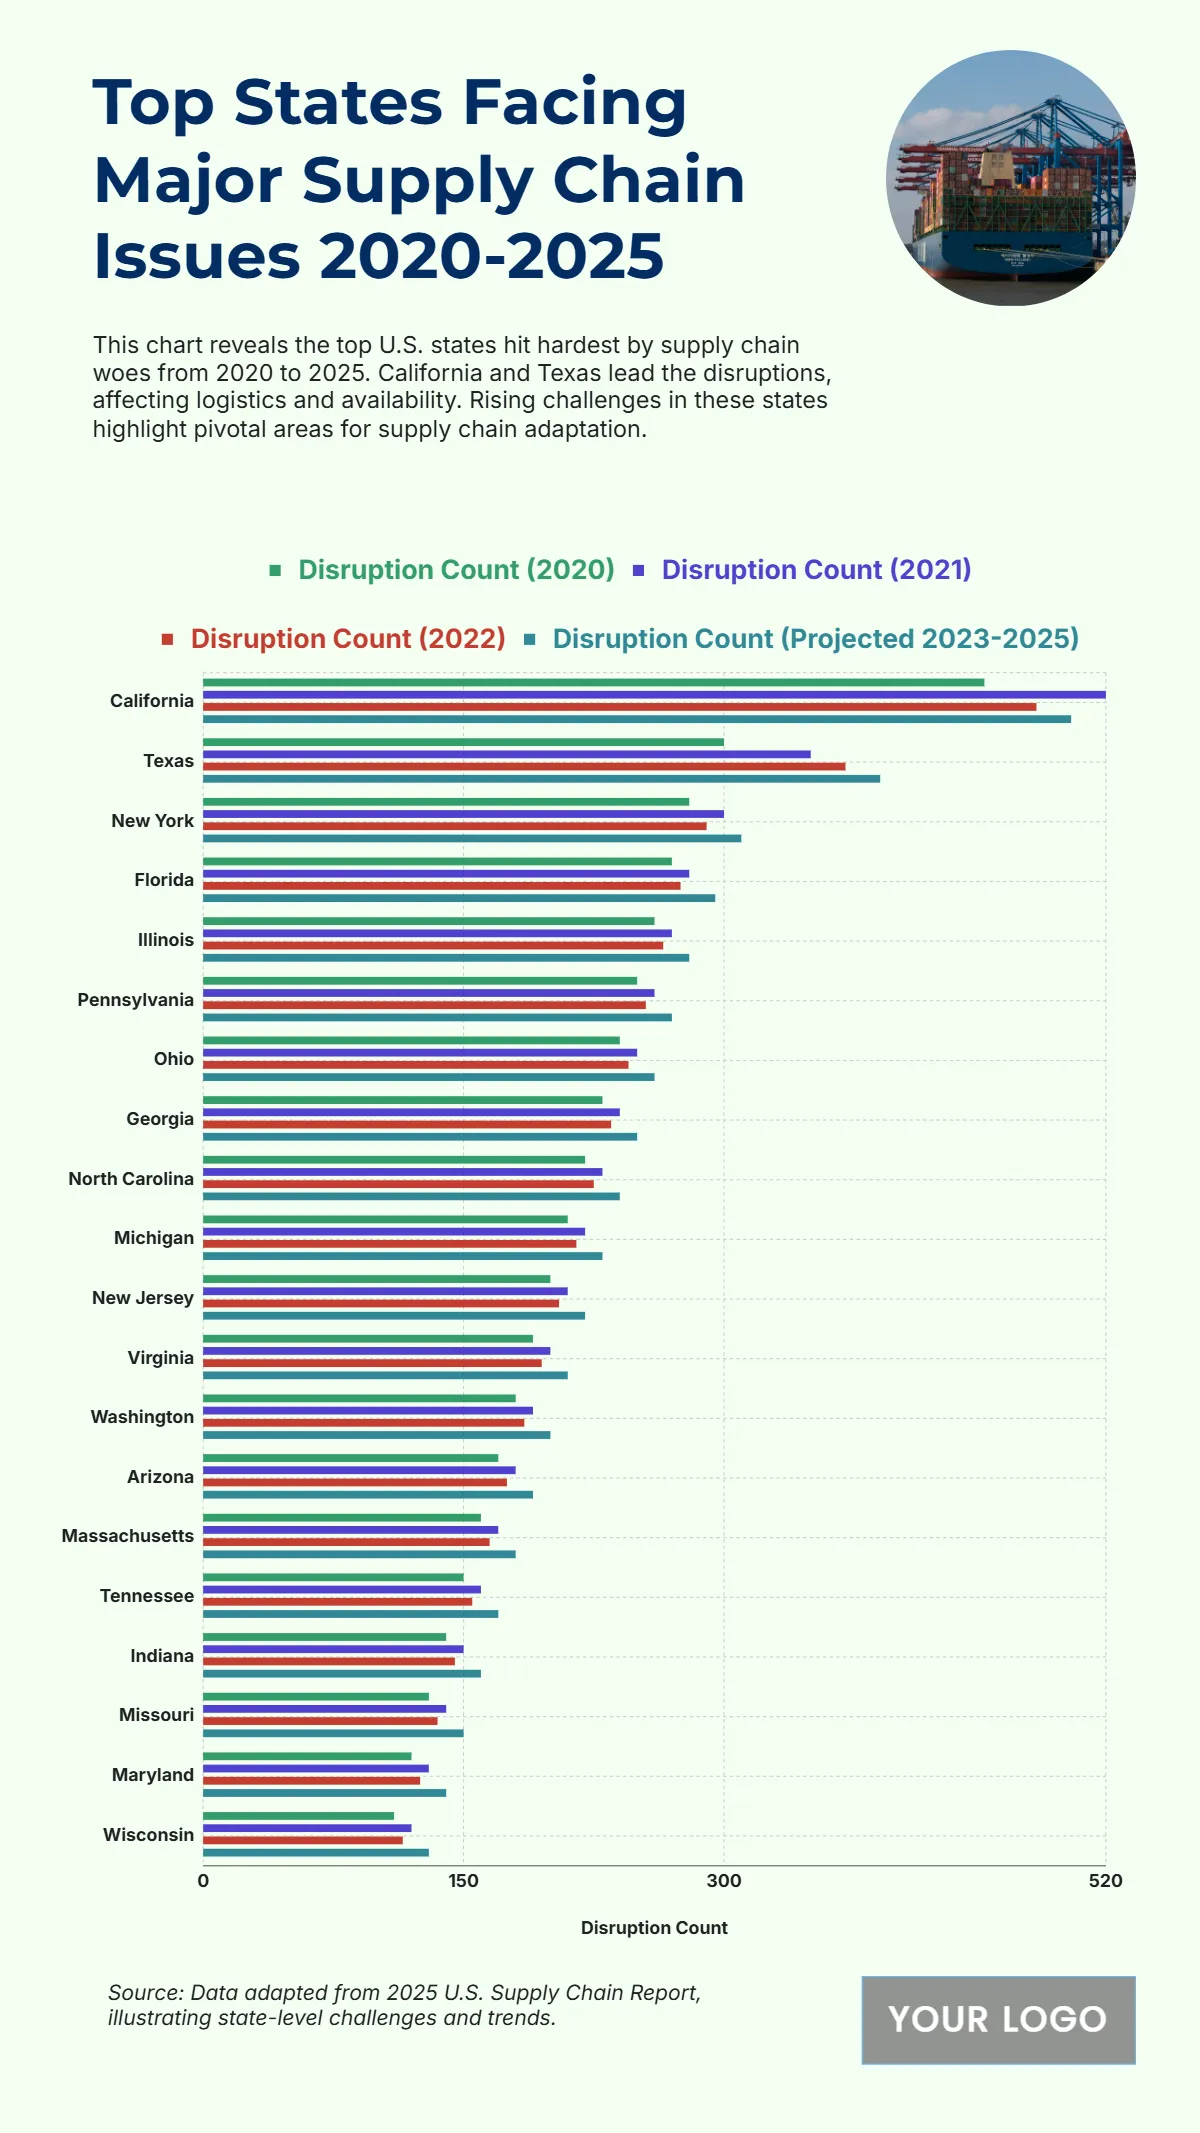
The chart illustrates the top U.S. states facing major supply chain issues from 2020 to 2025, reflecting widespread disruptions in logistics, production, and distribution networks. California records the highest disruption count, projected to exceed 500 incidents by 2025, largely due to congestion at major ports like Los Angeles and Long Beach, alongside manufacturing delays. Texas follows with around 420 disruptions, impacted by energy sector fluctuations and transportation bottlenecks. New York experiences approximately 370 cases, influenced by import dependency and warehouse constraints. Florida and Illinois each report about 330 and 310 disruptions, tied to freight congestion and retail supply challenges. Pennsylvania and Ohio register around 290 and 270, showing ripple effects across key manufacturing zones. Georgia, North Carolina, and Michigan round out the top ten with counts between 240 and 260, largely linked to automotive and logistics hubs. Other states such as New Jersey, Virginia, and Washington show moderate yet persistent issues. Overall, the data underscores ongoing supply chain stress across major economic centers, emphasizing the need for infrastructure resilience, diversification, and technological adaptation to mitigate future disruptions.
| Labels | Disruption Count (2020) | Disruption Count (2021) | Disruption Count (2022) |
Disruption Count (Projected 2023-2025) |
| California | 450 | 520 | 480 | 500 |
| Texas | 300 | 350 | 370 | 390 |
| New York | 280 | 300 | 290 | 310 |
| Florida | 270 | 280 | 275 | 295 |
| Illinois | 260 | 270 | 265 | 280 |
| Pennsylvania | 250 | 260 | 255 | 270 |
| Ohio | 240 | 250 | 245 | 260 |
| Georgia | 230 | 240 | 235 | 250 |
| North Carolina | 220 | 230 | 225 | 240 |
| Michigan | 210 | 220 | 215 | 230 |
| New Jersey | 200 | 210 | 205 | 220 |
| Virginia | 190 | 200 | 195 | 210 |
| Washington | 180 | 190 | 185 | 200 |
| Arizona | 170 | 180 | 175 | 190 |
| Massachusetts | 160 | 170 | 165 | 180 |
| Tennessee | 150 | 160 | 155 | 170 |
| Indiana | 140 | 150 | 145 | 160 |
| Missouri | 130 | 140 | 135 | 150 |
| Maryland | 120 | 130 | 125 | 140 |
| Wisconsin | 110 | 120 | 115 | 130 |


