Free Top 20 U.S. States by Household Net Worth (2015-2025) Chart
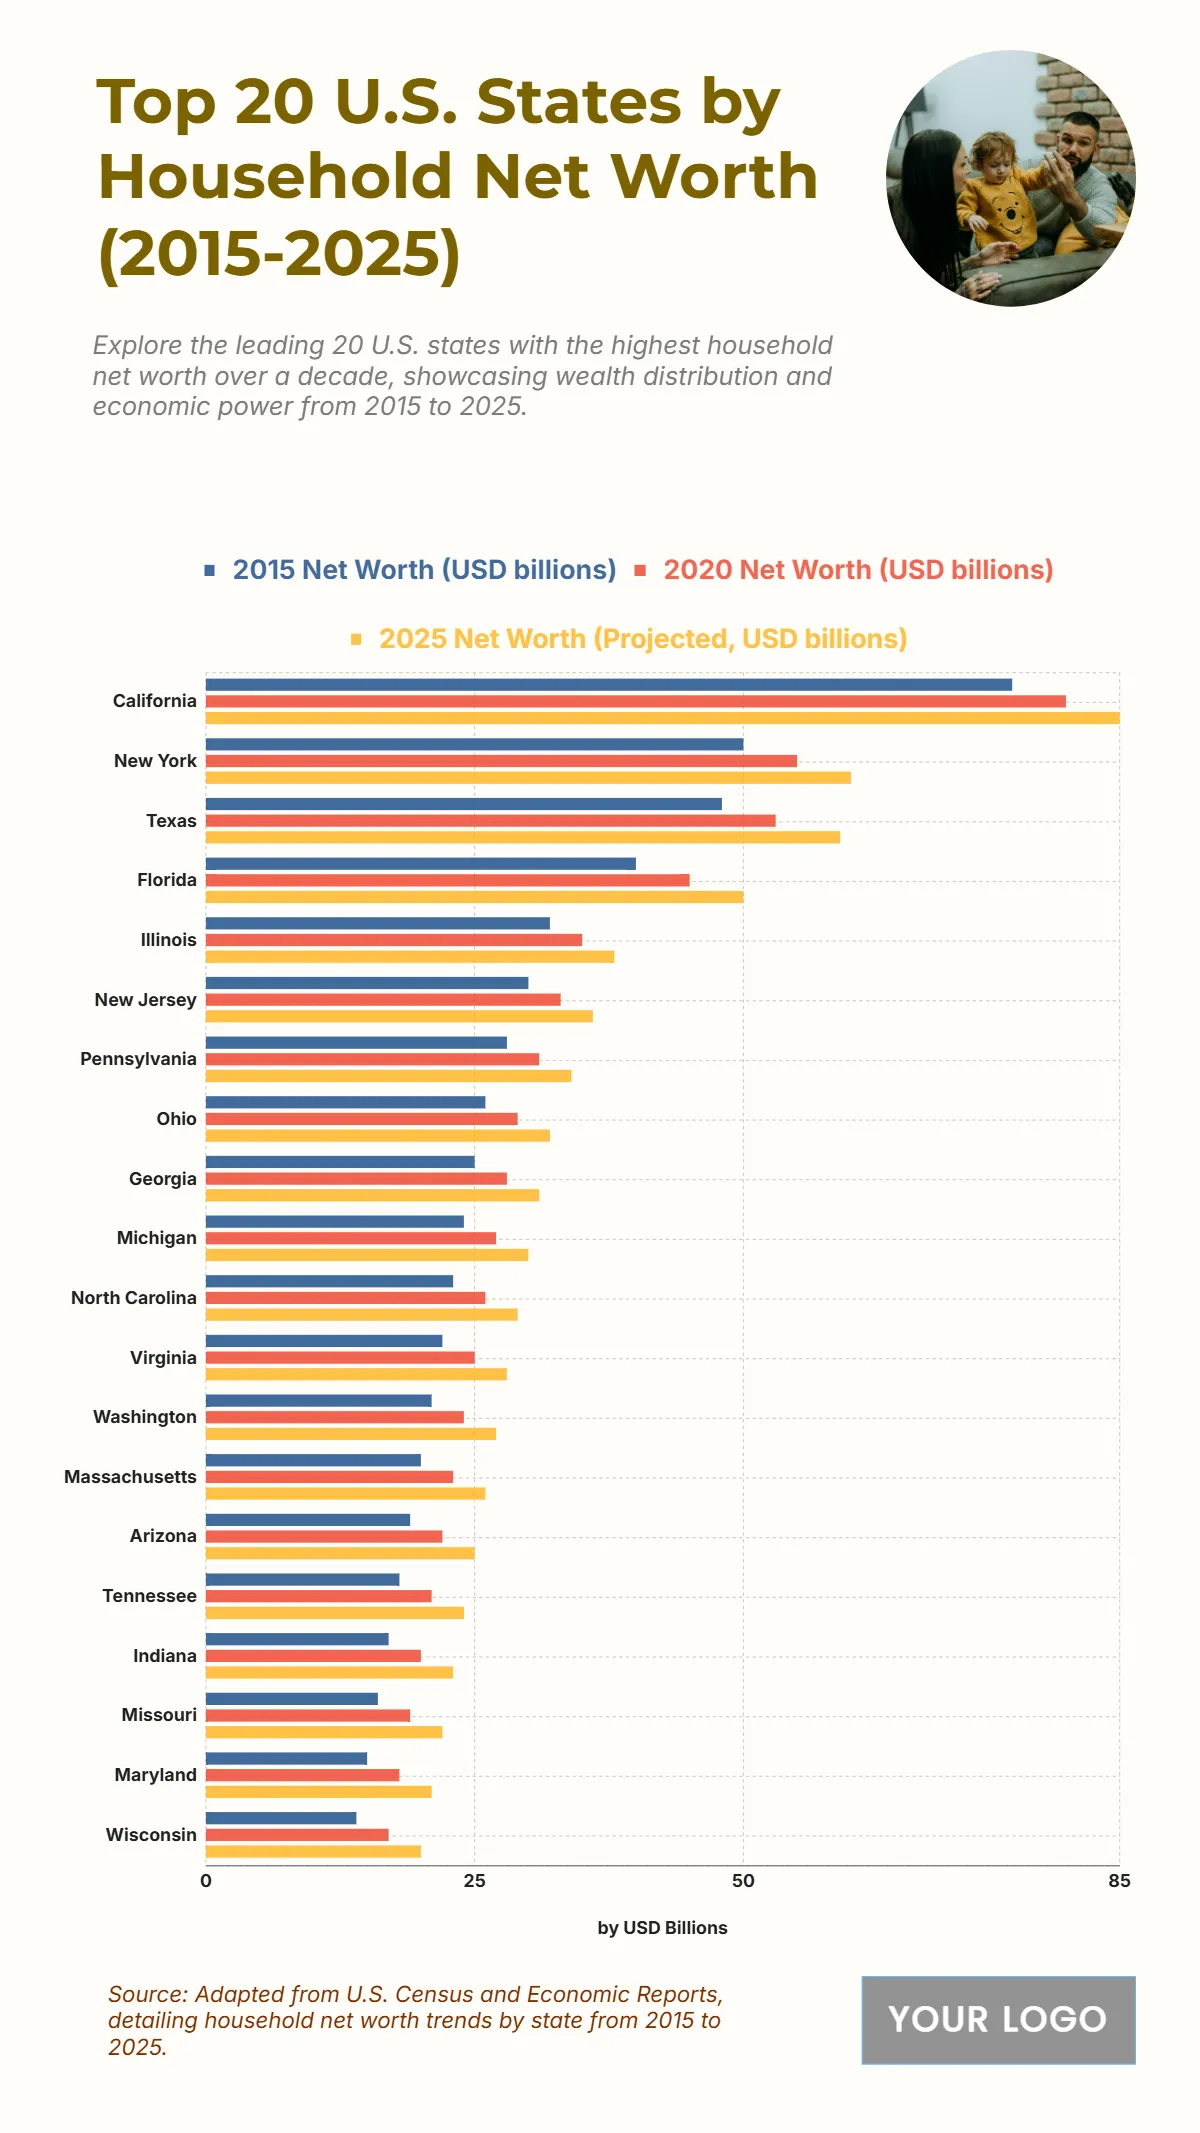
The chart reveals steady household net worth growth across the top 20 U.S. states from 2015 to 2025, underscoring rising economic power in key regions. California leads with net worth increasing from $75 billion in 2015 to $80 billion in 2020, and is projected to hit $85 billion by 2025, reflecting its dominant economy. New York follows with $50 billion, growing to $55 billion and expected to reach $60 billion. Texas shows significant gains from $48 billion to $53 billion, projected at $59 billion, while Florida climbs from $40 billion to $50 billion. Illinois, New Jersey, and Pennsylvania also see consistent increases, ranging between $32–38 billion by 2025. Emerging states like Georgia, Michigan, and North Carolina show gradual but notable upward trends. This decade-long rise highlights expanding household wealth concentration in major economic hubs.
| Labels | 2015 Net Worth (USD billions) | 2020 Net Worth (USD billions) | 2025 Net Worth (Projected, USD billions) |
|---|---|---|---|
| California | 75 | 80 | 85 |
| New York | 50 | 55 | 60 |
| Texas | 48 | 53 | 59 |
| Florida | 40 | 45 | 50 |
| Illinois | 32 | 35 | 38 |
| New Jersey | 30 | 33 | 36 |
| Pennsylvania | 28 | 31 | 34 |
| Ohio | 26 | 29 | 32 |
| Georgia | 25 | 28 | 31 |
| Michigan | 24 | 27 | 30 |
| North Carolina | 23 | 26 | 29 |
| Virginia | 22 | 25 | 28 |
| Washington | 21 | 24 | 27 |


