Free Top 10 U.S. States by Public Pension Funding (2020-2025)
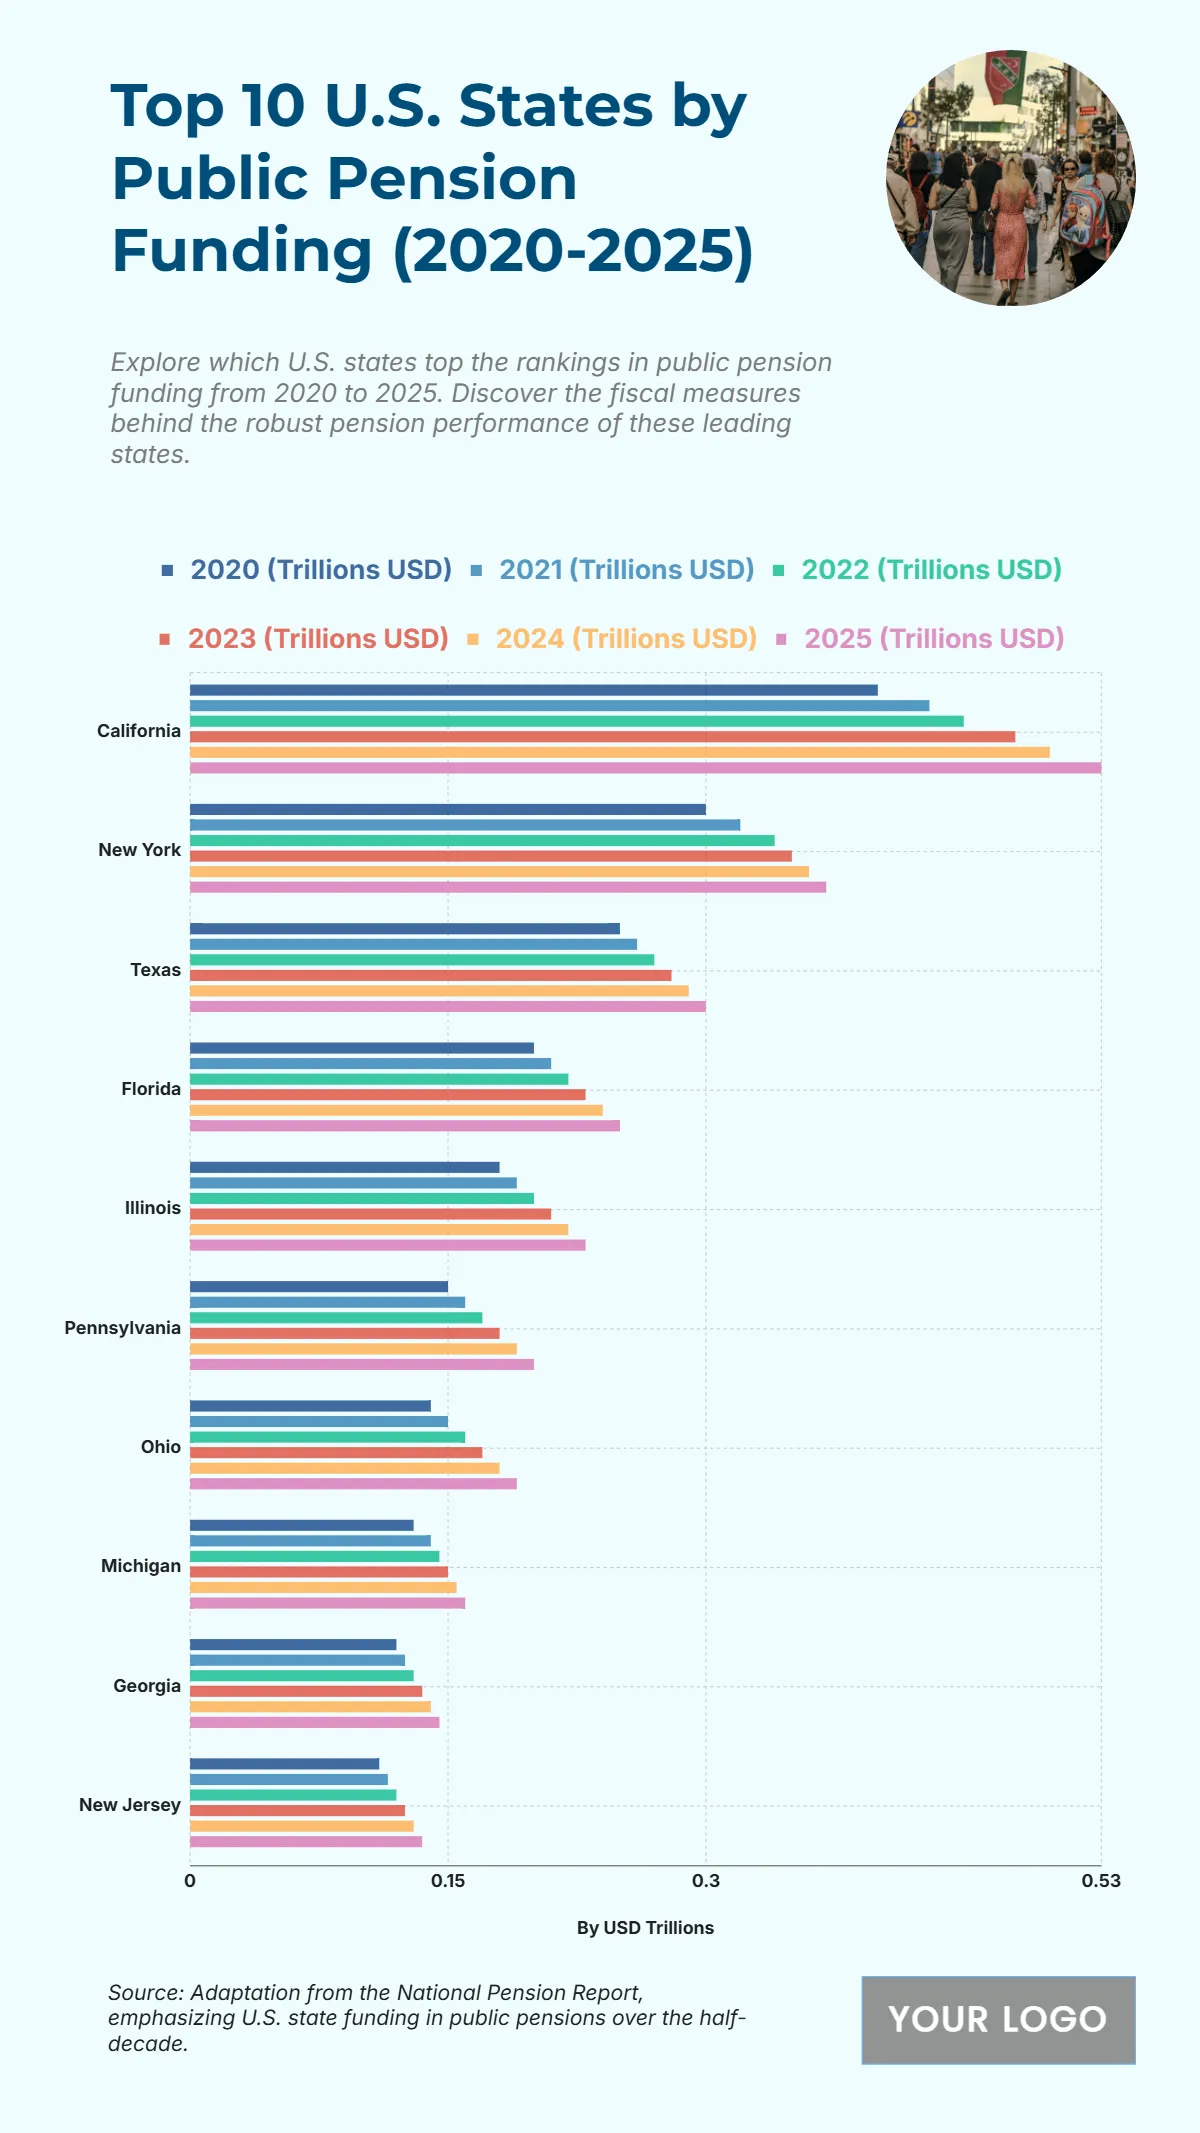
The chart shows the steady rise in public pension funding from 2020 to 2025, reflecting fiscal priorities across top-performing U.S. states. California leads consistently, increasing from $0.4 trillion in 2020 to $0.53 trillion in 2025, highlighting its dominant pension portfolio. New York follows with growth from $0.3 trillion to $0.37 trillion, while Texas rises from $0.25 trillion to $0.30 trillion. Florida moves from $0.20 trillion to $0.25 trillion, and Illinois from $0.18 trillion to $0.23 trillion. Mid-tier states like Pennsylvania ($0.15T to $0.20T), Ohio ($0.14T to $0.19T), and Michigan ($0.13T to $0.16T) demonstrate stable increases. Smaller but steady gains are also recorded in Georgia ($0.12T to $0.145T) and New Jersey ($0.11T to $0.135T). This upward trend underscores states’ commitment to pension fund strengthening, ensuring financial security for public sector retirees and reflecting solid fiscal planning over the five-year period.
| Labels | 2020 (T USD) | 2021 (T USD) | 2022 (T USD) | 2023 (T USD) | 2024 (T USD) | 2025 (T USD) |
|---|---|---|---|---|---|---|
| California | 0.40 | 0.43 | 0.45 | 0.48 | 0.50 | 0.53 |
| New York | 0.30 | 0.32 | 0.34 | 0.35 | 0.36 | 0.37 |
| Texas | 0.25 | 0.26 | 0.27 | 0.28 | 0.29 | 0.30 |
| Florida | 0.20 | 0.21 | 0.22 | 0.23 | 0.24 | 0.25 |
| Illinois | 0.18 | 0.19 | 0.20 | 0.21 | 0.22 | 0.23 |
| Pennsylvania | 0.15 | 0.16 | 0.17 | 0.18 | 0.19 | 0.20 |
| Ohio | 0.14 | 0.15 | 0.16 | 0.17 | 0.18 | 0.19 |
| Michigan | 0.13 | 0.14 | 0.145 | 0.15 | 0.155 | 0.16 |
| Georgia | 0.12 | 0.125 | 0.13 | 0.135 | 0.14 | 0.145 |
| New Jersey | 0.11 | 0.115 | 0.12 | 0.125 | 0.13 | 0.135 |


