Free Top 20 U.S. States by Total Foreign Investment (2020-2025)
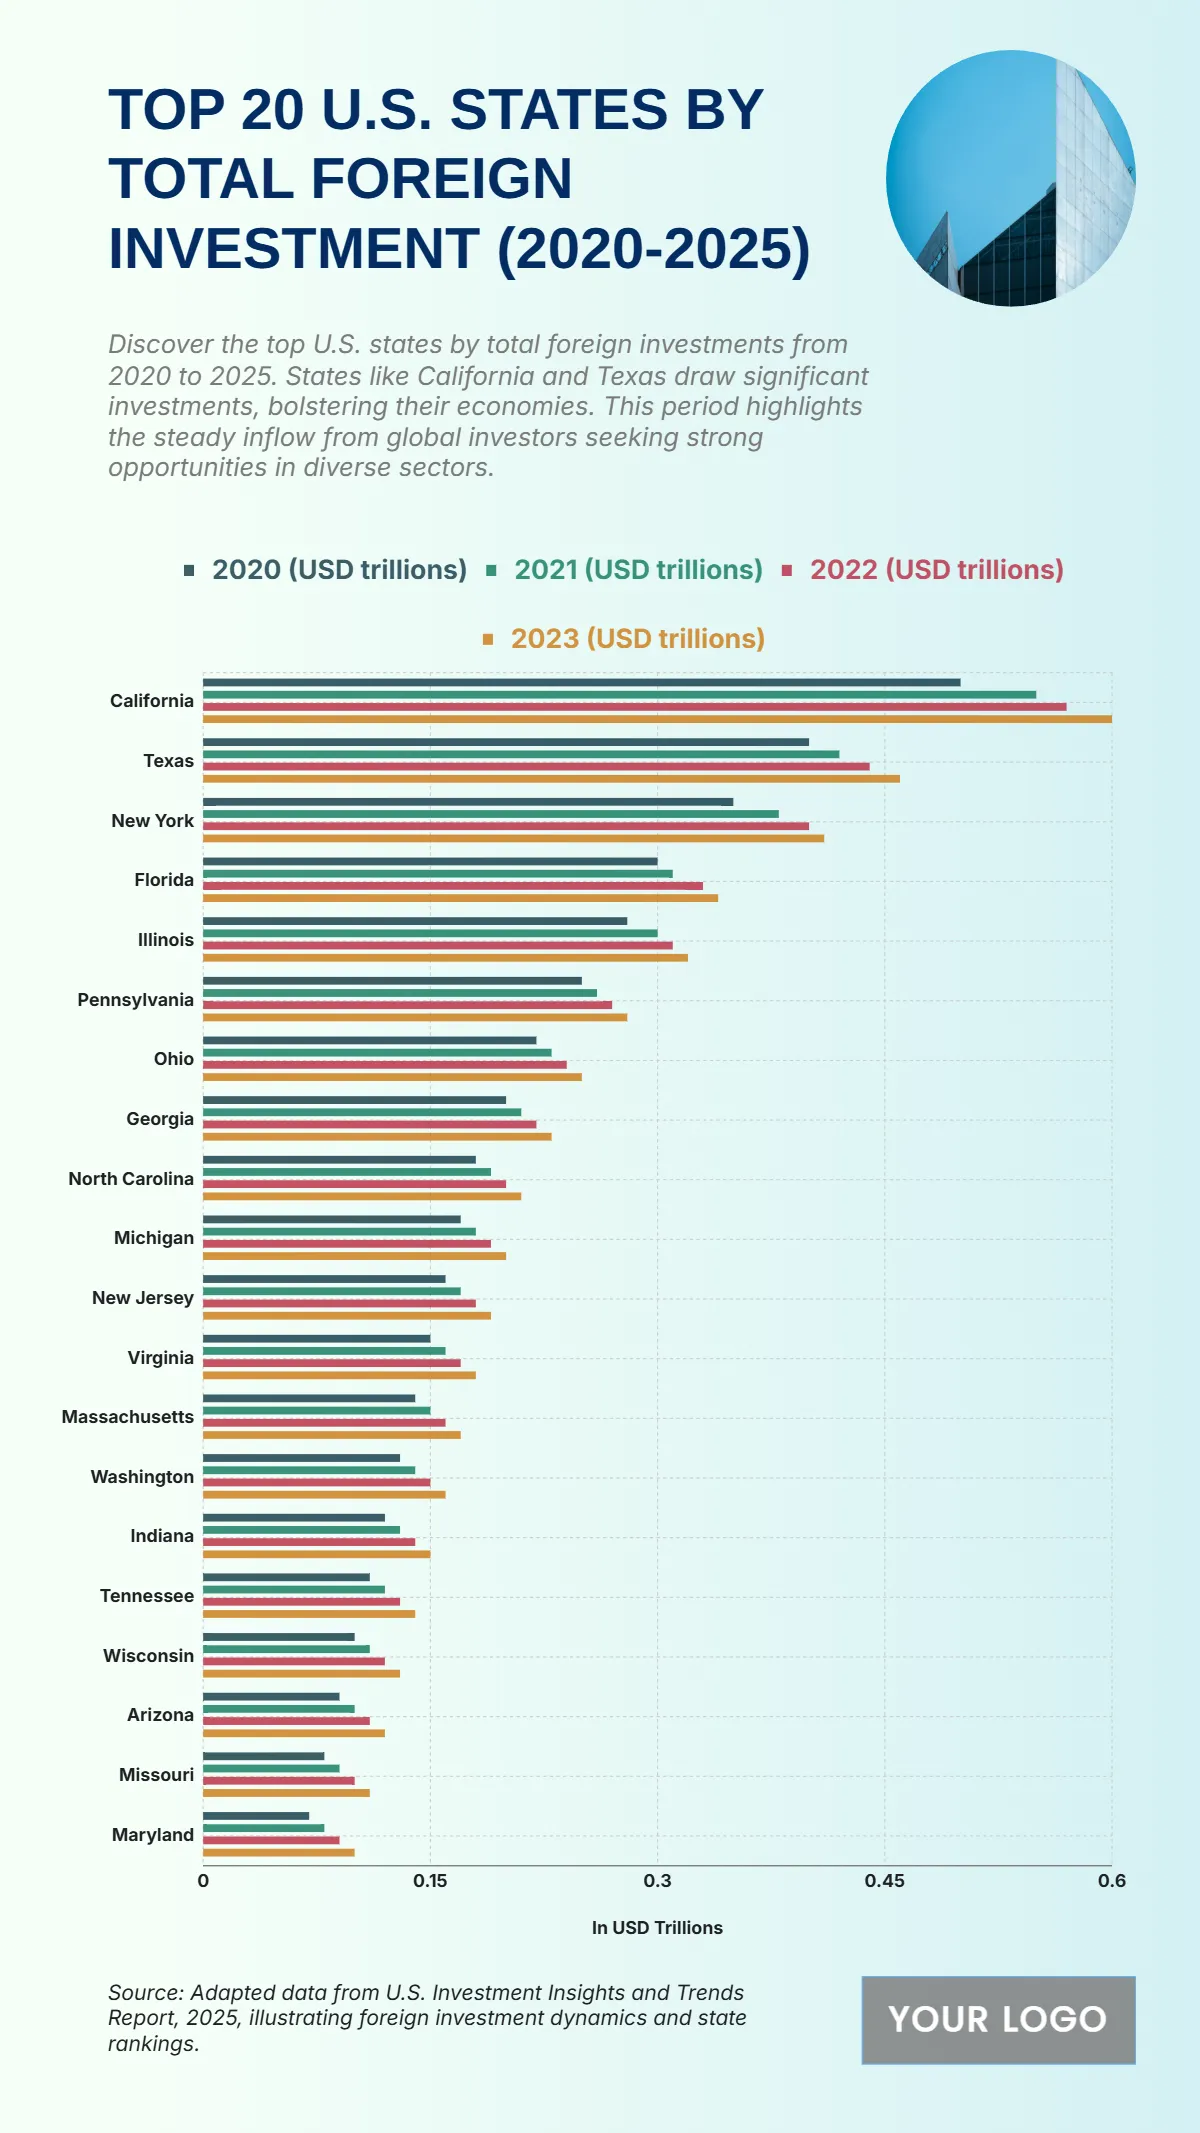
The chart shows the top states driving foreign investment growth from 2020 to 2025, revealing steady inflows of capital into major U.S. economies. California leads all states, growing from $0.50 trillion in 2020 to $0.60 trillion in 2023, underscoring its strong global investment appeal. Texas follows closely, increasing from $0.40 trillion to $0.46 trillion, while New York records $0.35 trillion to $0.41 trillion, showing sustained investor confidence. Mid-tier states such as Florida ($0.30T to $0.34T), Illinois ($0.28T to $0.32T), and Pennsylvania ($0.25T to $0.28T) also reflect consistent growth trajectories. Smaller but notable increases are seen in Ohio ($0.22T to $0.24T), Georgia ($0.20T to $0.23T), and North Carolina ($0.18T to $0.21T). Lower but stable gains are observed across states like Michigan, New Jersey, and Virginia, highlighting broad geographic diversification in foreign capital inflows and indicating sustained investor confidence across multiple economic hubs.
| Labels | 2020 (USD trillions) | 2021 (USD trillions) | 2022 (USD trillions) | 2023 (USD trillions) |
|---|---|---|---|---|
| California | 0.50 | 0.55 | 0.57 | 0.60 |
| Texas | 0.40 | 0.42 | 0.44 | 0.46 |
| New York | 0.35 | 0.38 | 0.40 | 0.41 |
| Florida | 0.30 | 0.31 | 0.33 | 0.34 |
| Illinois | 0.28 | 0.30 | 0.31 | 0.32 |
| Pennsylvania | 0.25 | 0.26 | 0.27 | 0.28 |
| Ohio | 0.22 | 0.23 | 0.24 | 0.24 |
| Georgia | 0.20 | 0.21 | 0.22 | 0.23 |
| North Carolina | 0.18 | 0.19 | 0.20 | 0.21 |
| Michigan | 0.17 | 0.18 | 0.19 | 0.20 |
| New Jersey | 0.16 | 0.17 | 0.18 | 0.19 |
| Virginia | 0.15 | 0.16 | 0.17 | 0.18 |
| Massachusetts | 0.14 | 0.15 | 0.16 | 0.17 |
| Washington | 0.13 | 0.14 | 0.15 | 0.16 |
| Indiana | 0.12 | 0.13 | 0.14 | 0.14 |
| Tennessee | 0.11 | 0.12 | 0.13 | 0.13 |
| Wisconsin | 0.10 | 0.11 | 0.12 | 0.12 |
| Arizona | 0.09 | 0.10 | 0.11 | 0.11 |
| Missouri | 0.08 | 0.09 | 0.10 | 0.11 |
| Maryland | 0.07 | 0.08 | 0.09 | 0.09 |


