Free Top 10 U.S. States with the Most Significant Job Vacancies (2020-2025)
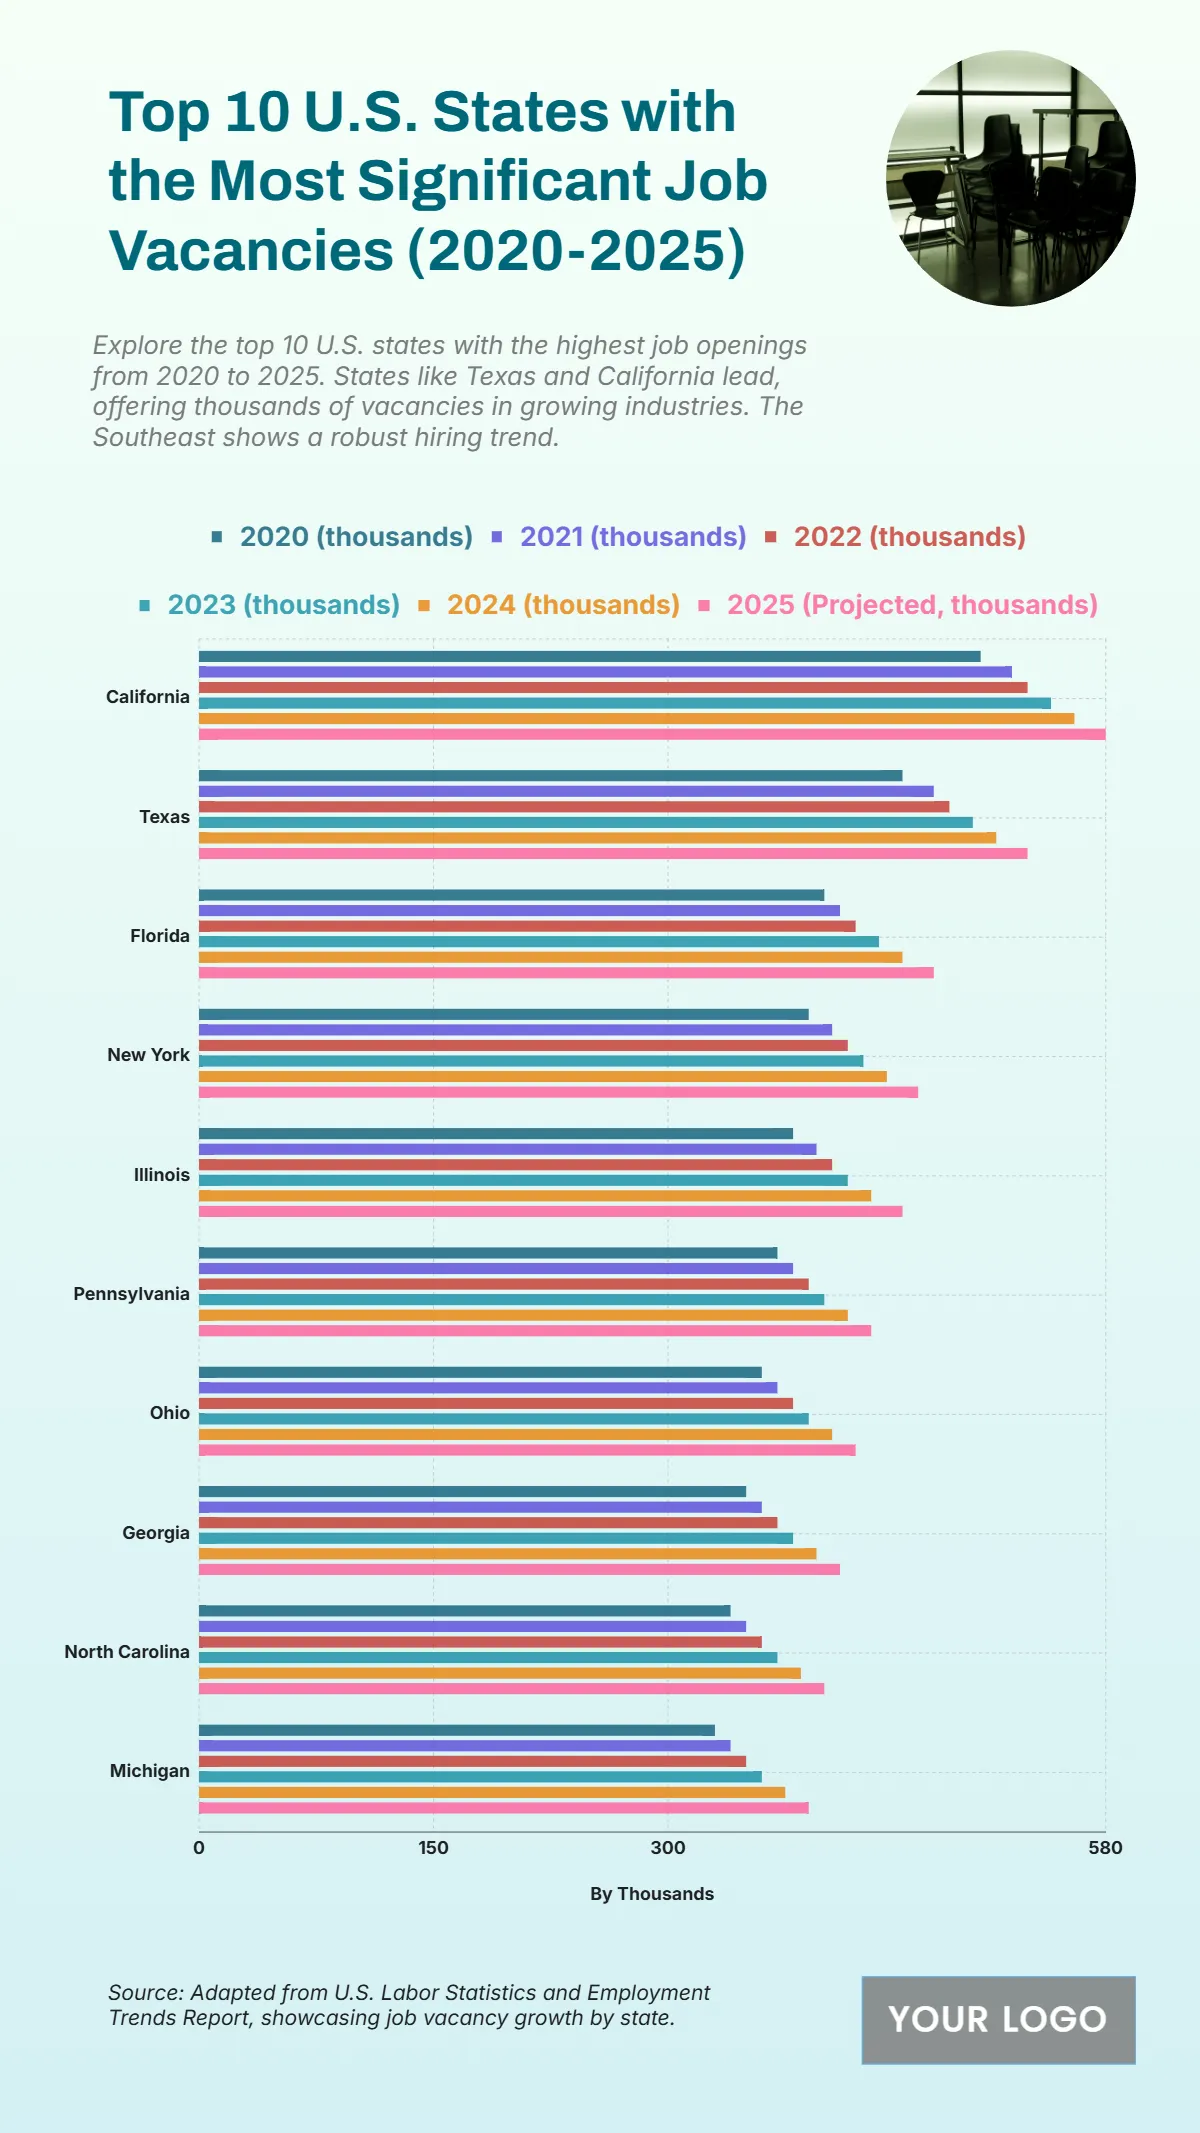
The chart reveals the steady growth of job vacancies across the top 10 U.S. states from 2020 to 2025, with notable increases in hiring demand. California consistently leads with job openings rising from 500,000 in 2020 to a projected 580,000 in 2025, reflecting its robust labor market. Texas follows with an increase from 450,000 to 530,000, highlighting its strong economic expansion. Florida grows from 400,000 to 470,000, while New York climbs from 390,000 to 460,000, signaling sustained employment opportunities. Mid-tier states such as Illinois (380,000 to 450,000), Pennsylvania (370,000 to 430,000), and Ohio (360,000 to 420,000) also exhibit positive growth trends. Southern states like Georgia, North Carolina, and Michigan show steady increases, reaching 410,000, 400,000, and 390,000 job vacancies respectively by 2025. This upward trend underscores expanding industries and stronger workforce demand across key economic states.
| Labels | 2020 (thousands) | 2021 (thousands) | 2022 (thousands) | 2023 (thousands) | 2024 (thousands) | 2025 (Projected, thousands) |
|---|---|---|---|---|---|---|
| California | 500 | 520 | 530 | 545 | 560 | 580 |
| Texas | 450 | 470 | 480 | 495 | 510 | 530 |
| Florida | 400 | 410 | 420 | 435 | 450 | 470 |
| New York | 390 | 405 | 415 | 425 | 440 | 460 |
| Illinois | 380 | 395 | 405 | 415 | 430 | 450 |
| Pennsylvania | 370 | 380 | 390 | 400 | 415 | 430 |
| Ohio | 360 | 370 | 380 | 390 | 405 | 420 |
| Georgia | 350 | 360 | 370 | 380 | 395 | 410 |
| North Carolina | 340 | 350 | 360 | 370 | 385 | 400 |
| Michigan | 330 | 340 | 350 | 360 | 375 | 390 |


