Free Top 10 U.S. States by Retail Sales Growth (2015-2025)
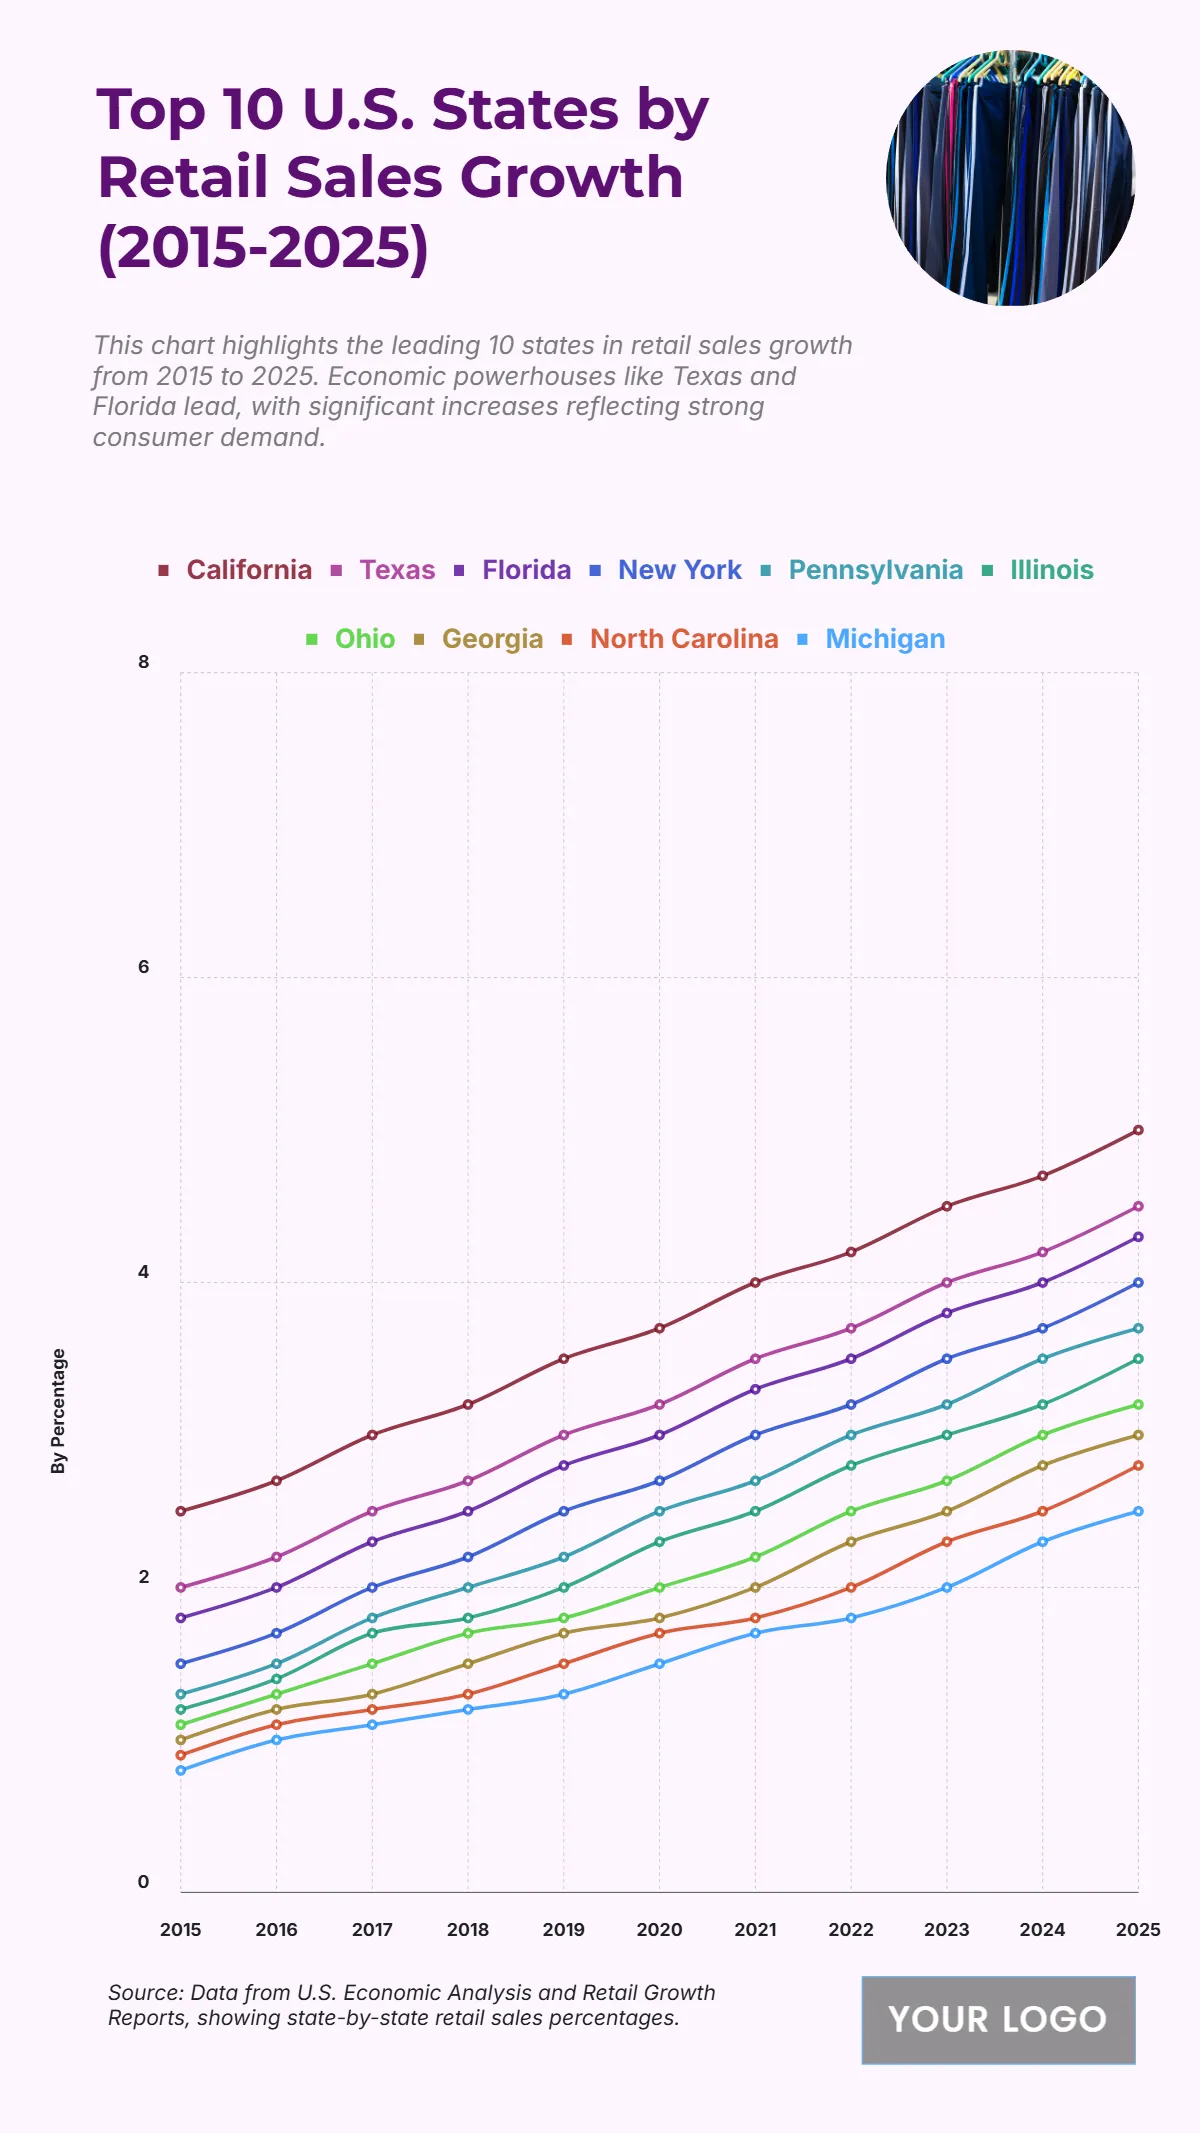
The chart illustrates a steady upward trend in retail sales growth across 10 U.S. states from 2015 to 2025, with California maintaining the highest growth trajectory. California rises from 2.5% in 2015 to 5.0% in 2025, followed by Texas, which grows from 2.0% to 4.5%, and Florida increasing from 1.8% to 4.3%. New York also shows notable improvement from 1.5% to 4.0%, while Pennsylvania climbs from 1.3% to 3.7%. Mid-tier states like Illinois and Ohio reach 3.5% and 3.2% by 2025, reflecting steady gains. Meanwhile, Georgia grows from 1.0% to 3.0%, indicating accelerating consumer demand. North Carolina and Michigan also record strong momentum, increasing from 0.9% to 2.8% and 0.8% to 2.5%, respectively. These figures highlight robust consumer spending trends, emphasizing expanding retail markets across major states over the decade.
| Labels | 2015 | 2016 | 2017 | 2018 | 2019 | 2020 | 2021 | 2022 | 2023 | 2024 | 2025 |
|---|---|---|---|---|---|---|---|---|---|---|---|
| California | 2.5 | 2.7 | 3.0 | 3.2 | 3.5 | 3.7 | 4.0 | 4.2 | 4.5 | 4.7 | 5.0 |
| Texas | 2.0 | 2.2 | 2.5 | 2.7 | 3.0 | 3.2 | 3.5 | 3.7 | 4.0 | 4.2 | 4.5 |
| Florida | 1.8 | 2.0 | 2.3 | 2.5 | 2.8 | 3.2 | 3.3 | 3.5 | 3.8 | 4.0 | 4.3 |
| New York | 1.5 | 1.7 | 2.0 | 2.2 | 2.5 | 2.7 | 3.0 | 3.2 | 3.5 | 3.7 | 4.0 |
| Pennsylvania | 1.3 | 1.5 | 1.8 | 2.0 | 2.2 | 2.5 | 2.7 | 2.8 | 3.2 | 3.5 | 3.7 |
| Illinois | 1.2 | 1.4 | 1.7 | 1.8 | 2.0 | 2.3 | 2.5 | 2.8 | 3.0 | 3.2 | 3.5 |
| Ohio | 1.1 | 1.3 | 1.5 | 1.7 | 1.8 | 2.0 | 2.2 | 2.5 | 2.7 | 3.0 | 3.2 |
| Georgia | 1.0 | 1.2 | 1.3 | 1.5 | 1.7 | 1.8 | 2.0 | 2.3 | 2.5 | 2.8 | 3.0 |
| North Carolina | 0.9 | 1.1 | 1.2 | 1.3 | 1.5 | 1.7 | 1.8 | 2.0 | 2.3 | 2.5 | 2.8 |
| Michigan | 0.8 | 1.0 | 1.1 | 1.2 | 1.3 | 1.5 | 1.7 | 1.8 | 2.0 | 2.3 | 2.5 |


