Free Top 10 U.S. States by Public Transit Ridership Growth (2015-2025)
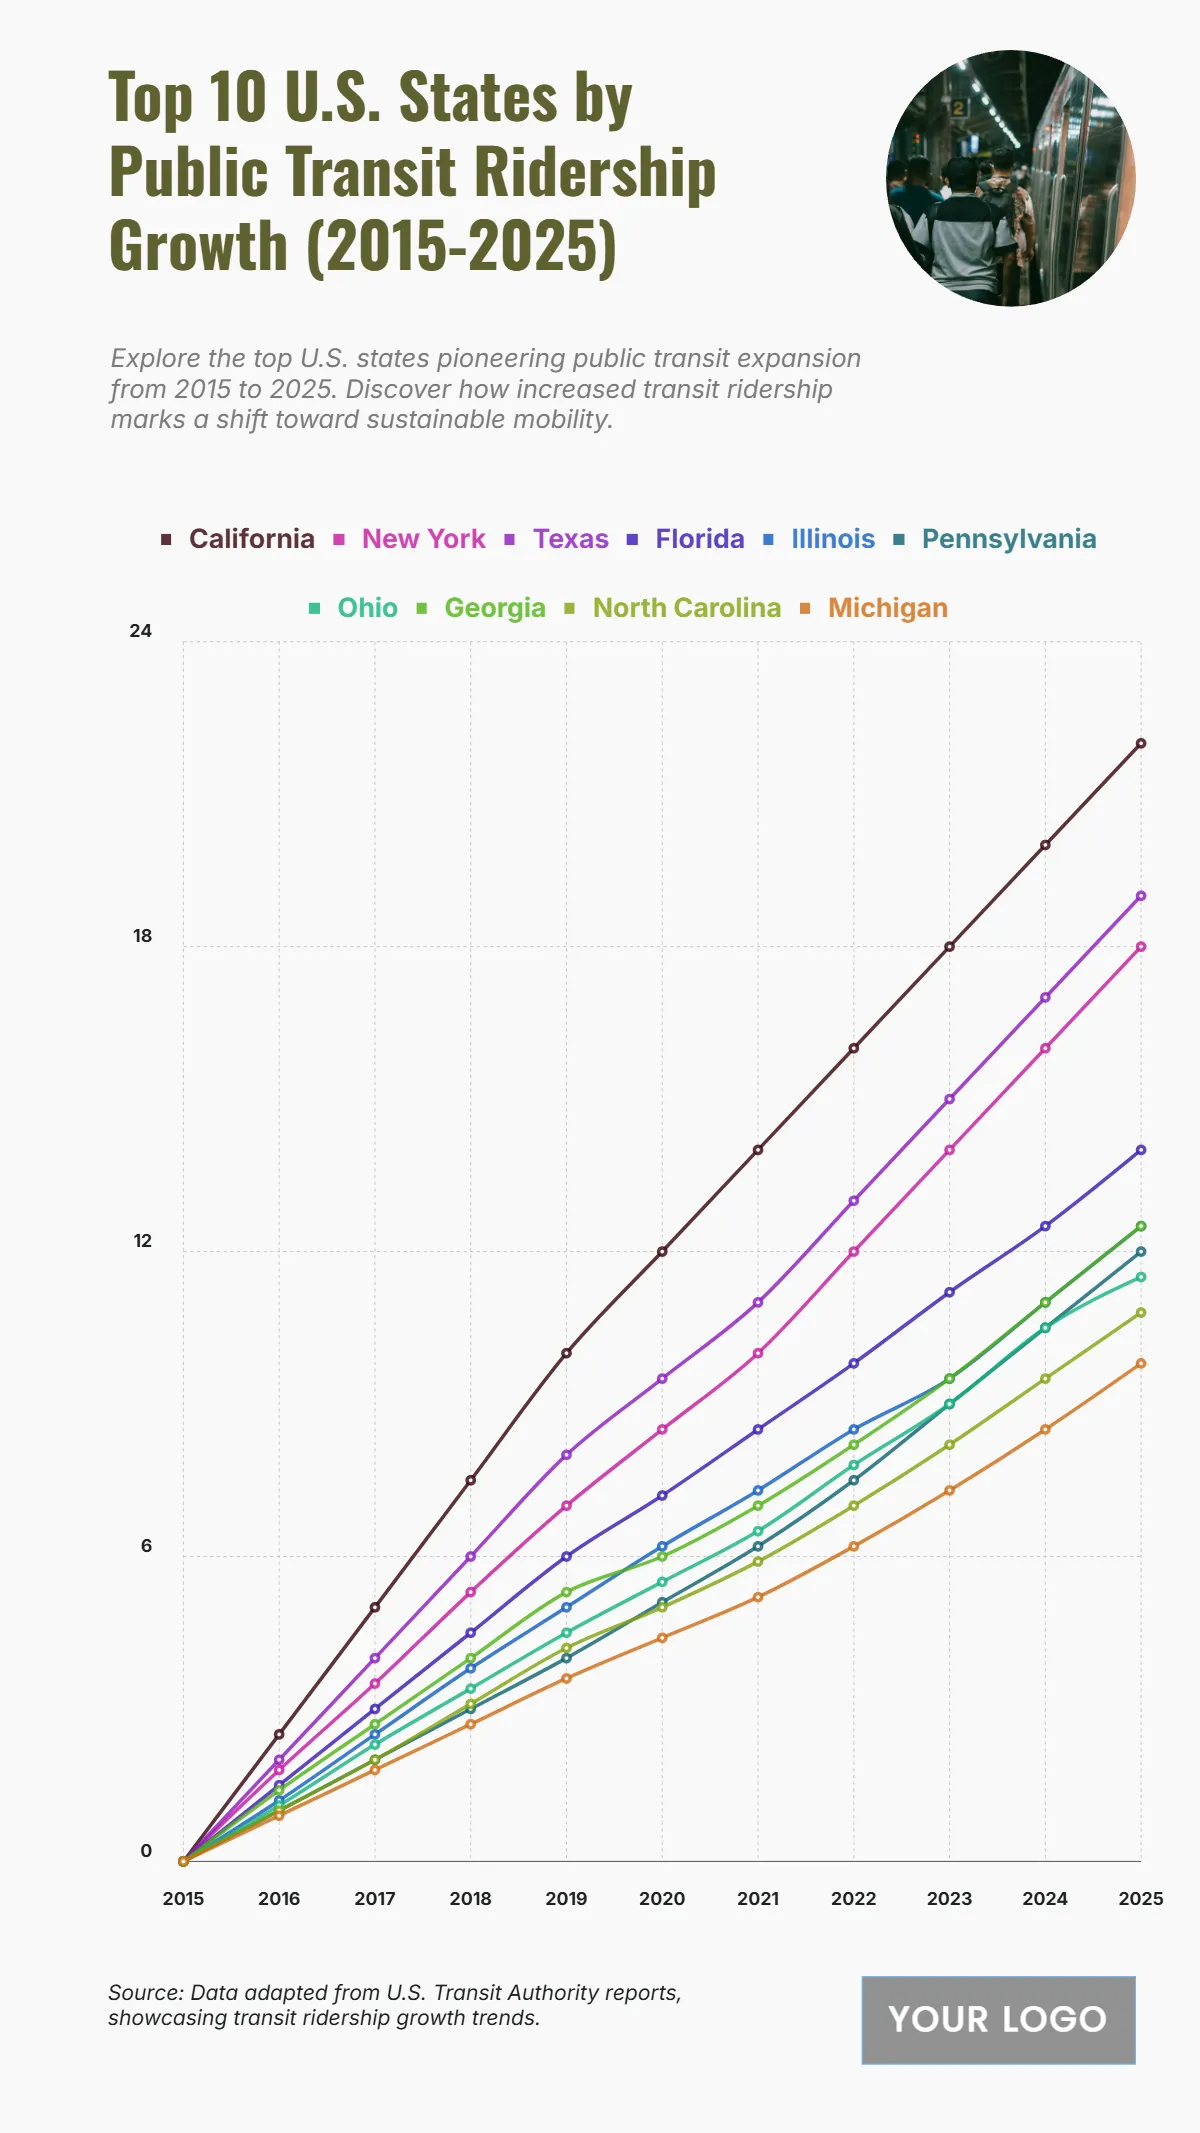
The chart shows a steady increase in public transit ridership across the top 10 U.S. states from 2015 to 2025, signaling a strong shift toward sustainable transportation. California leads the growth, rising from 0 million riders in 2015 to 22 million in 2025, reflecting significant investment and expansion. New York follows with 18 million, while Texas grows to 19 million, emphasizing rapid urban transit development. Florida, Illinois, and Pennsylvania also demonstrate consistent growth, reaching 14 million, 12.5 million, and 12 million respectively by 2025. Meanwhile, Ohio and Georgia both increase to 12.5 million, showcasing robust mid-tier growth. North Carolina and Michigan, though starting lower, climb to 10.8 million and 9.8 million, respectively, highlighting rising adoption in emerging transit regions. The consistent upward trend across all states reflects expanding infrastructure, increased urbanization, and stronger policy support for public transit.
| Labels | California | New York | Texas | Florida | Illinois | Pennsylvania | Ohio | Georgia | North Carolina | Michigan |
|---|---|---|---|---|---|---|---|---|---|---|
| 2015 | 0 | 0 | 0 | 0 | 0 | 0 | 0 | 0 | 0 | 0 |
| 2016 | 2.5 | 1.8 | 2 | 1.5 | 1.2 | 1 | 1.1 | 1.4 | 1 | 0.9 |
| 2017 | 5 | 3.5 | 4 | 3 | 2.5 | 2 | 2.3 | 2.7 | 2 | 1.8 |
| 2018 | 7.5 | 5.3 | 6 | 4.5 | 3.8 | 3 | 3.4 | 3.4 | 3.1 | 2.7 |
| 2019 | 10 | 7 | 8 | 6 | 5 | 4 | 4.5 | 5.3 | 4.2 | 3.6 |
| 2020 | 12 | 8.5 | 9.5 | 7.2 | 6.2 | 5.1 | 5.5 | 5.5 | 5 | 4.4 |
| 2021 | 14 | 10 | 11 | 8.5 | 7.3 | 6.2 | 6.5 | 6.5 | 5.9 | 5.2 |
| 2022 | 16 | 12 | 13 | 9.8 | 8.5 | 7.5 | 7.8 | 8.2 | 7 | 6.2 |
| 2023 | 18 | 14 | 15 | 11.2 | 9.5 | 9 | 9 | 9.5 | 8.2 | 7.3 |
| 2024 | 20 | 16 | 17 | 12.5 | 11 | 10.5 | 10.5 | 11 | 9.5 | 8.5 |
| 2025 | 22 | 18 | 19 | 14 | 12.5 | 12 | 11.5 | 12.5 | 10.8 | 9.8 |


