Free U.S. Top 5 States by Renewable Energy Capacity (2018-2025)
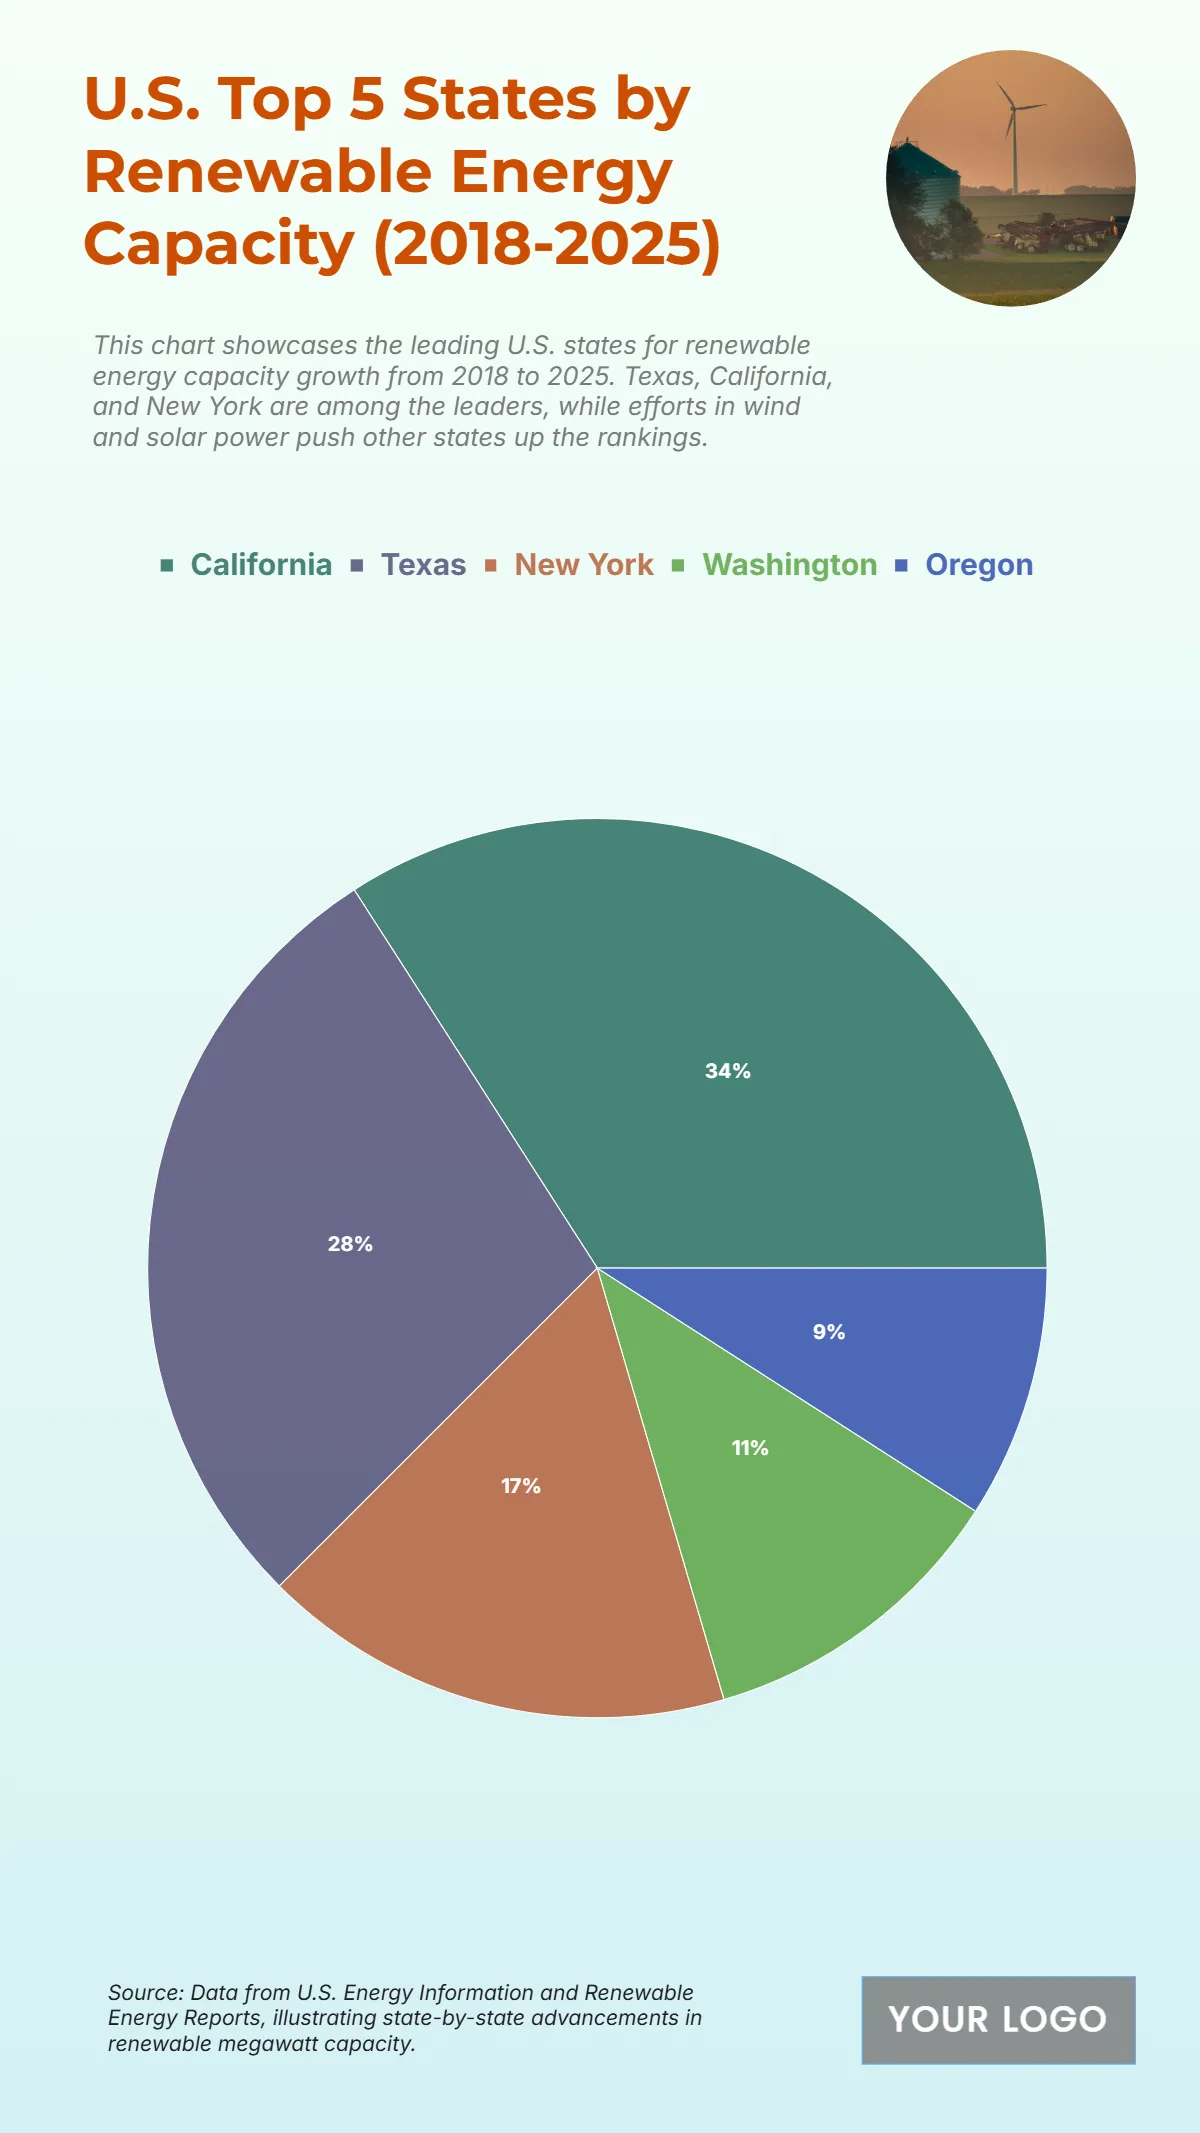
The chart shows the leading U.S. states in renewable energy capacity from 2018 to 2025, highlighting the dominance of a few key states in driving clean energy growth. California leads with 34% of total capacity, equating to 30,000 MW, showcasing its strong commitment to solar and wind energy. Texas follows with 28% or 25,000 MW, supported by major investments in wind power. New York contributes 17% with 15,000 MW, reflecting steady progress in renewable infrastructure. Washington accounts for 11% with 10,000 MW, driven by hydroelectric resources, while Oregon holds 9% with 8,000 MW, emphasizing balanced renewable integration. The data clearly illustrates that California and Texas together account for over 60% of the total capacity, underlining their leadership in the U.S. renewable energy transition.
| Labels | Renewable Energy Capacity (MW) |
|---|---|
| California | 30,000 |
| Texas | 25,000 |
| New York | 15,000 |
| Washington | 10,000 |
| Oregon | 8,000 |


