Free Top 10 U.S. States by Change in Unemployment Claims (2020-2025)
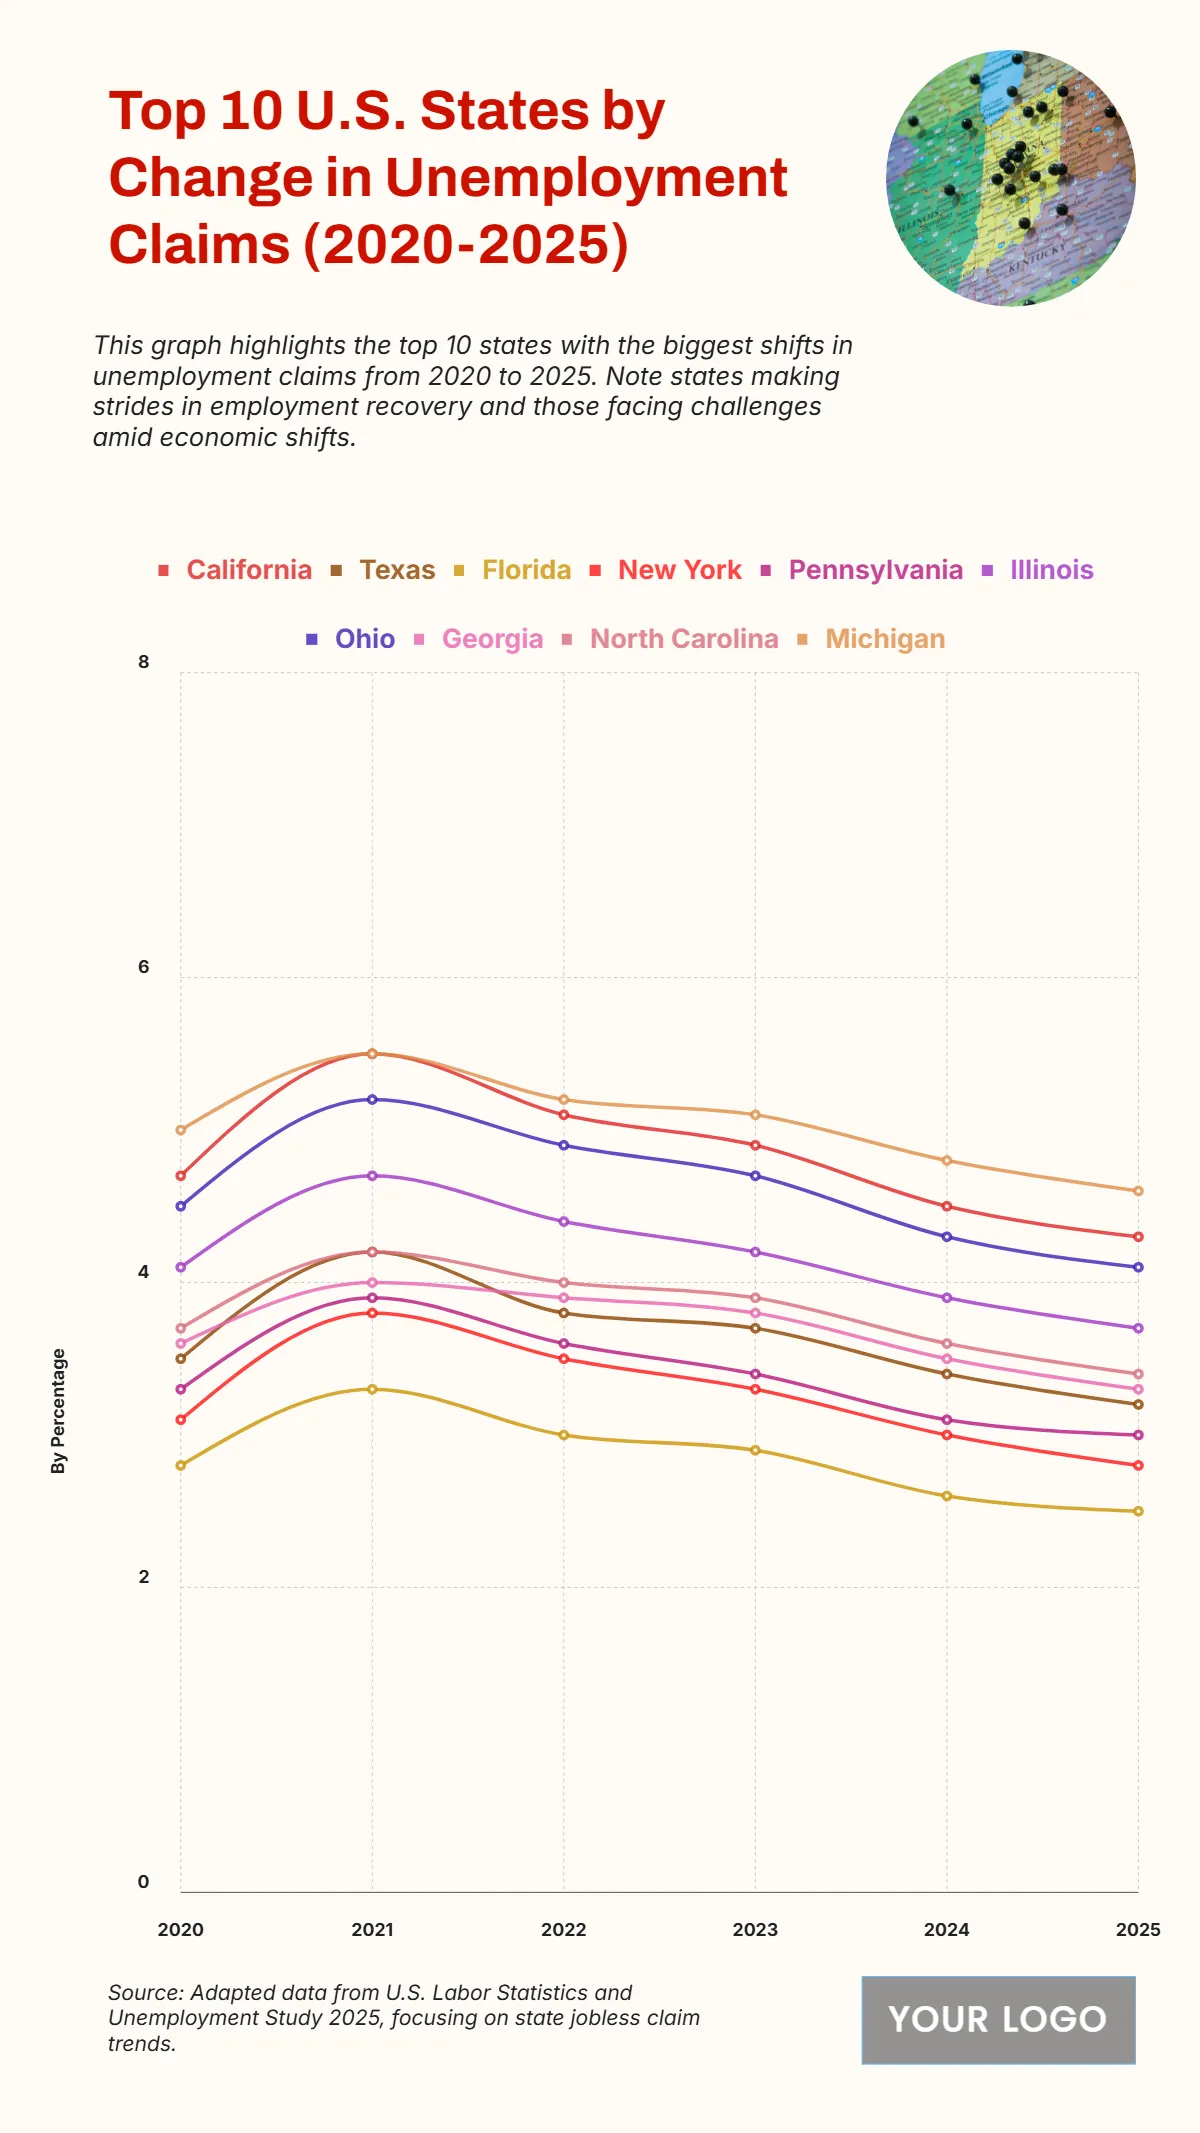
The chart shows how unemployment claims across the top 10 U.S. states shifted from 2020 to 2025, highlighting both economic recovery and fluctuations across states. California recorded the highest claim rates, peaking at 5.5% in 2021 before falling to 4.3% in 2025. Texas followed a similar pattern, reaching 4.2% in 2021 and then declining to 3.2%. Florida, with the lowest rates among the top states, decreased steadily from 2.8% in 2020 to 2.5% in 2025. New York, Pennsylvania, and Illinois showed slight fluctuations but overall downward trends, reaching 2.8%, 3%, and 3.7% respectively by 2025. Ohio consistently had one of the higher rates, peaking at 5.2% in 2021 and then easing to 4.1%. Georgia, North Carolina, and Michigan also displayed similar recovery patterns, with Michigan showing the highest among the three at 4.6% in 2025. Overall, the steady decline across states reflects improving labor market conditions.
| Labels | California | Texas | Florida | New York | Pennsylvania | Illinois | Ohio | Georgia | North Carolina | Michigan |
|---|---|---|---|---|---|---|---|---|---|---|
| 2020 | 4.7 | 3.5 | 2.8 | 3.1 | 3.3 | 4.1 | 4.5 | 3.6 | 3.7 | 5.0 |
| 2021 | 5.5 | 4.2 | 3.3 | 3.8 | 3.9 | 4.7 | 5.2 | 4.0 | 4.2 | 5.5 |
| 2022 | 5.1 | 3.8 | 3.0 | 3.5 | 3.6 | 4.4 | 4.9 | 3.9 | 4.0 | 5.2 |
| 2023 | 4.9 | 3.7 | 2.9 | 3.3 | 3.4 | 4.2 | 4.7 | 3.8 | 3.9 | 5.1 |
| 2024 | 4.5 | 3.4 | 2.6 | 3.0 | 3.1 | 3.9 | 4.3 | 3.5 | 3.6 | 4.8 |
| 2025 | 4.3 | 3.2 | 2.5 | 2.8 | 3.0 | 3.7 | 4.1 | 3.3 | 3.4 | 4.6 |


