Free Top 10 U.S. States by Change in Workforce Automation (2018-2025)
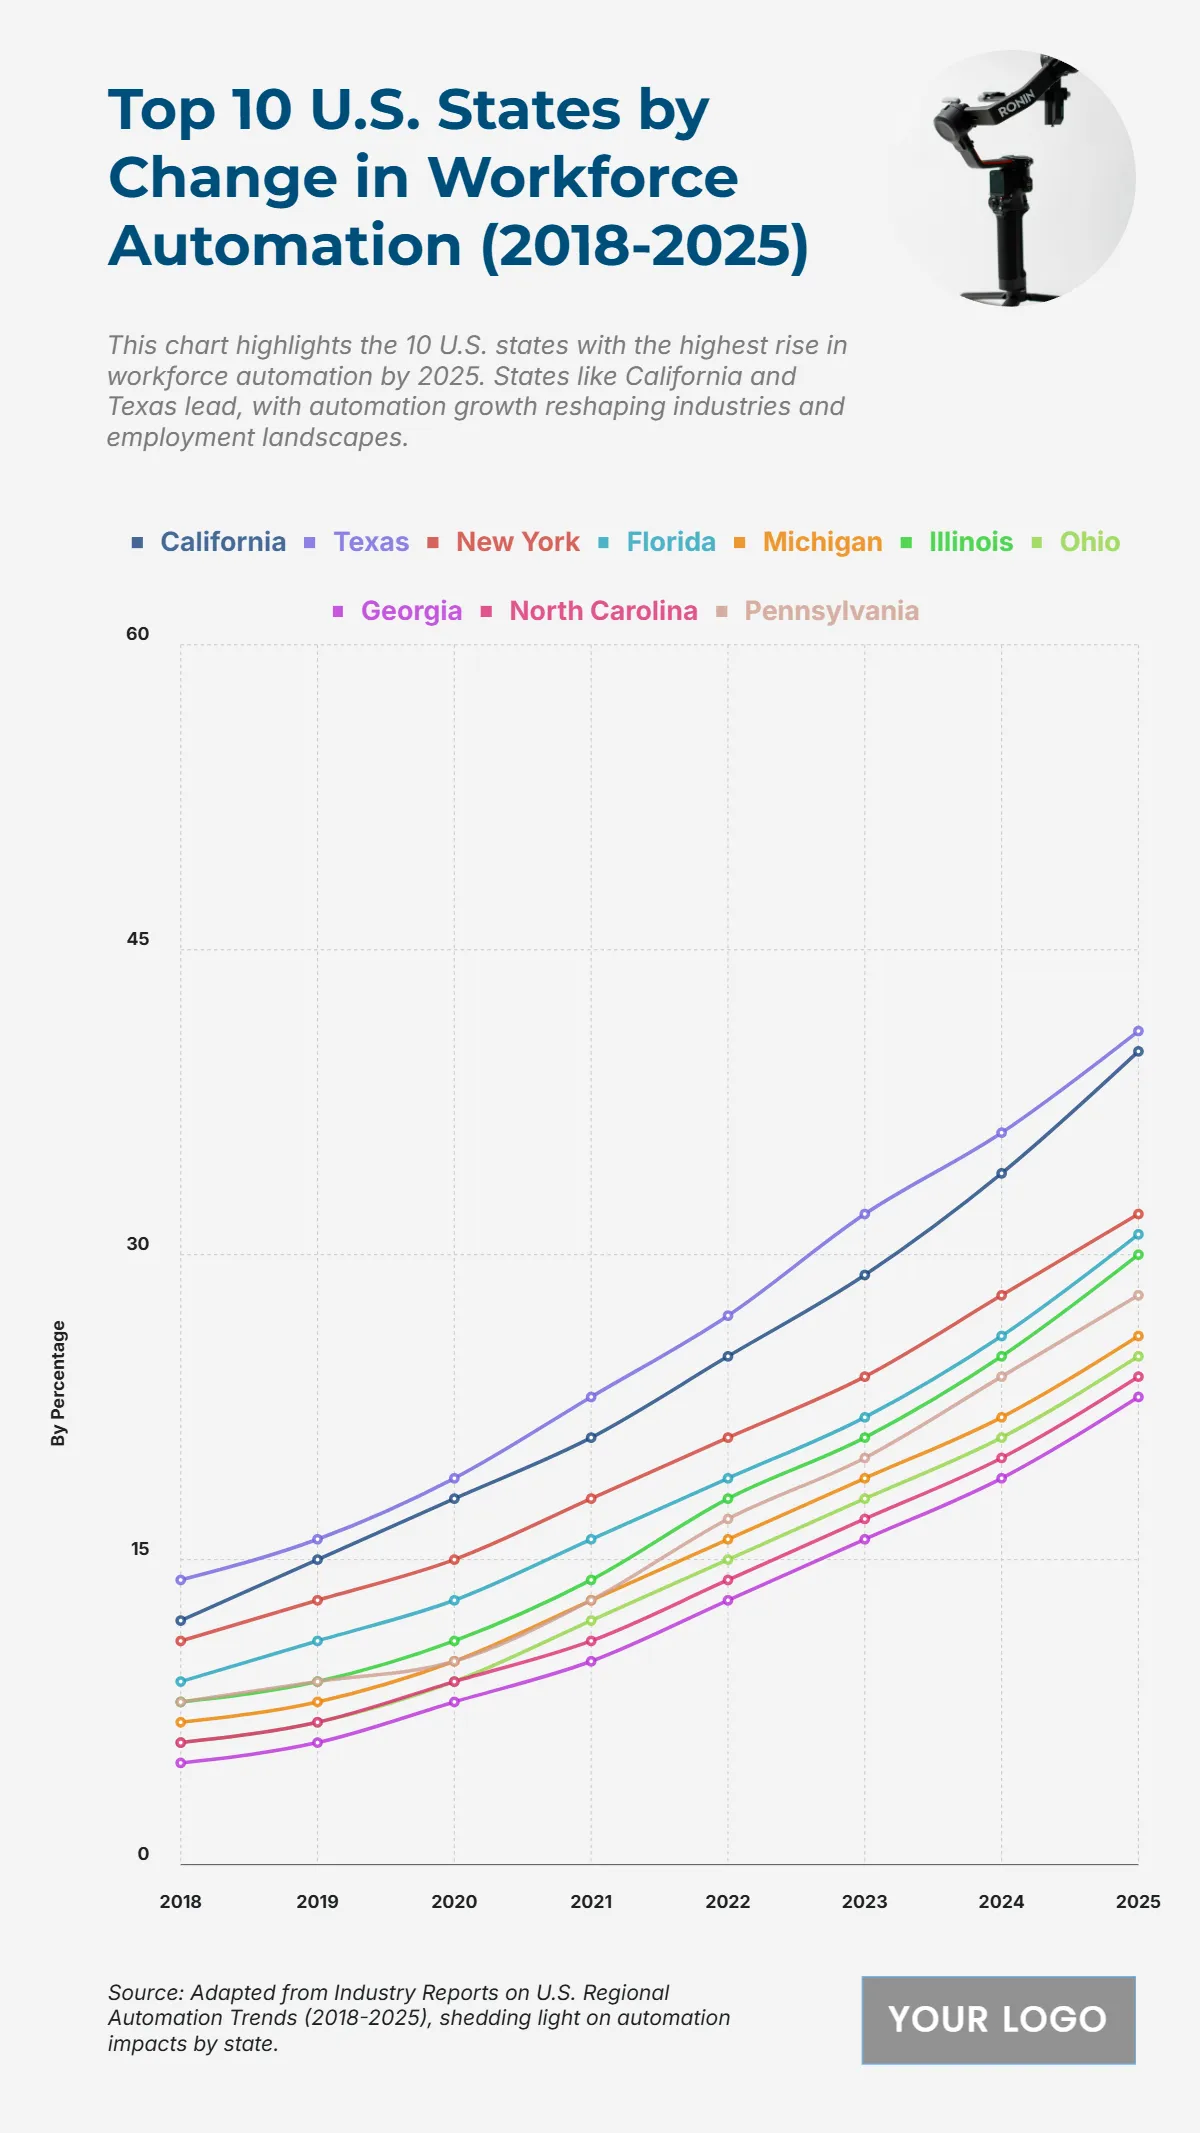
The chart highlights a notable acceleration in workforce automation across the top 10 U.S. states between 2018 and 2025, signaling rapid technological transformation. Texas leads the trend, rising from 14% in 2018 to 41% in 2025, closely followed by California, which climbs from 12% to 40% over the same period. New York also shows strong growth, increasing from 11% to 32%, while Florida moves from 9% to 31%. Meanwhile, Illinois shows a steep rise to 30%, surpassing other Midwestern states. States like Michigan (26%), Ohio (25%), and Georgia (23%) reveal consistent upward trends, indicating widespread automation adoption. North Carolina and Pennsylvania show lower starting points but still experience significant jumps, reaching 24% and 28% respectively. Overall, the trend reflects widespread automation expansion, with technology reshaping industries and impacting employment landscapes nationwide.
| Labels | 2018 | 2019 | 2020 | 2021 | 2022 | 2023 | 2024 | 2025 |
|---|---|---|---|---|---|---|---|---|
| California | 12 | 15 | 18 | 21 | 25 | 29 | 34 | 40 |
| Texas | 14 | 16 | 19 | 23 | 27 | 32 | 36 | 41 |
| New York | 11 | 13 | 15 | 18 | 21 | 24 | 28 | 32 |
| Florida | 9 | 11 | 13 | 16 | 19 | 22 | 26 | 31 |
| Michigan | 7 | 8 | 10 | 13 | 16 | 19 | 22 | 26 |
| Illinois | 8 | 9 | 11 | 14 | 18 | 21 | 25 | 30 |
| Ohio | 6 | 7 | 9 | 12 | 15 | 18 | 21 | 25 |
| Georgia | 5 | 6 | 8 | 10 | 13 | 16 | 19 | 23 |
| North Carolina | 6 | 7 | 9 | 11 | 14 | 17 | 20 | 24 |
| Pennsylvania | 8 | 9 | 10 | 13 | 17 | 20 | 24 | 28 |


