Free Top 20 U.S. States by Per Capita Spending on Utilities (2015-2025)
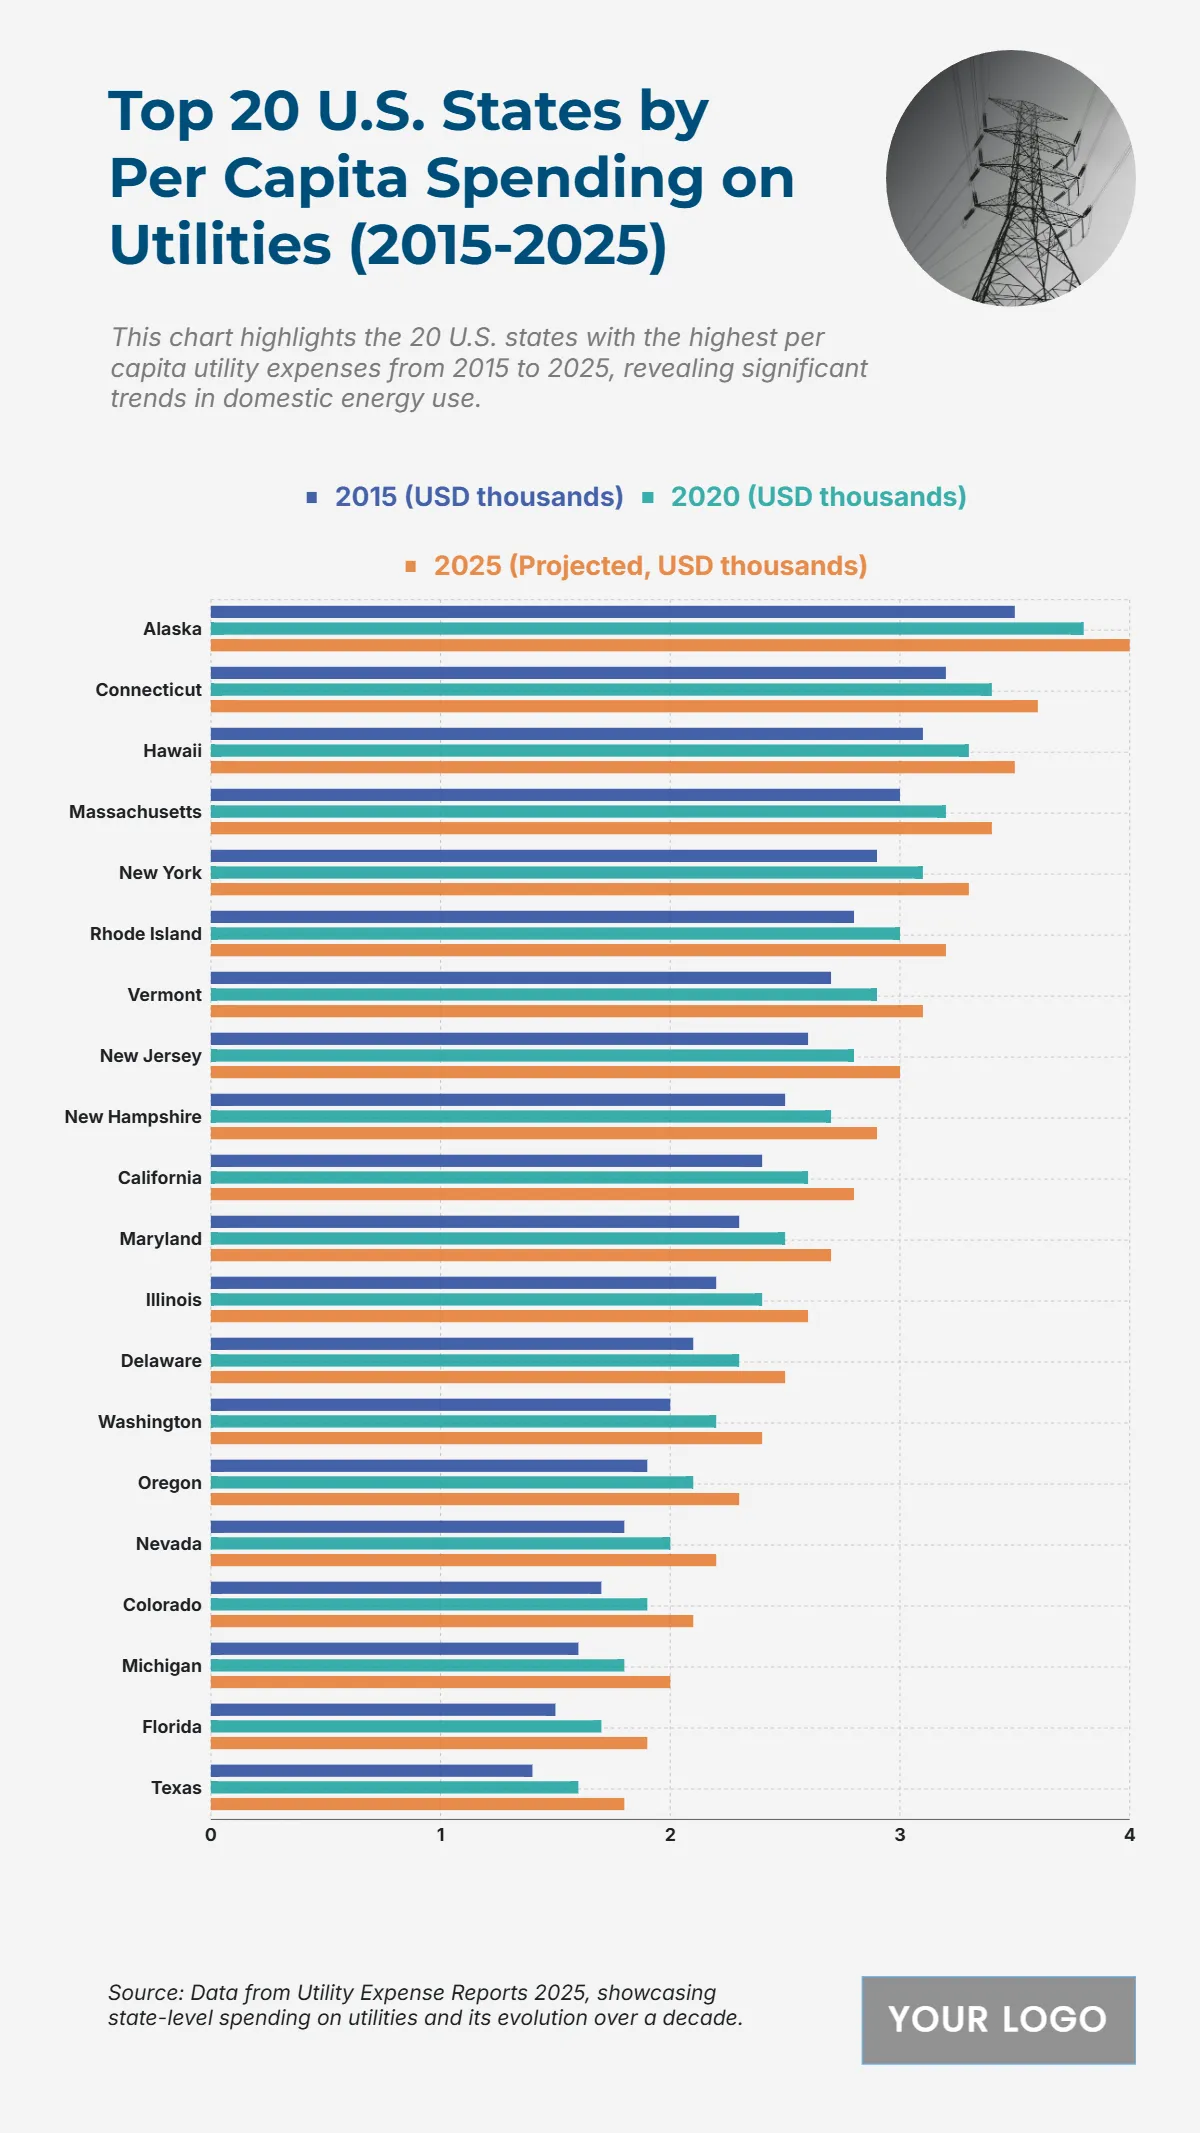
The chart shows how per capita spending on utilities across the top 20 U.S. states increased steadily from 2015 to 2025, reflecting rising domestic energy consumption and costs. Alaska recorded the highest spending, climbing from $3.5K in 2015 to $4K in 2025. Connecticut followed at $3.6K, while Hawaii reached $3.5K, indicating high utility expenses in these states. Massachusetts, New York, and Rhode Island also showed notable growth, rising to $3.4K, $3.3K, and $3.2K respectively by 2025. Mid-range states such as California and Maryland increased from $2.4K to $2.8K and $2.3K to $2.7K, respectively. Meanwhile, Florida and Texas, with lower per capita spending, grew from $1.5K and $1.4K to $1.9K and $1.8K. Overall, all states experienced a steady climb over the decade, with northern and coastal states facing the highest utility expenses.
| Labels | 2015 (USD thousands) | 2020 (USD thousands) | 2025 (Projected, USD thousands) |
|---|---|---|---|
| Alaska | 3.5 | 3.8 | 4.0 |
| Connecticut | 3.2 | 3.4 | 3.6 |
| Hawaii | 3.1 | 3.3 | 3.5 |
| Massachusetts | 3.0 | 3.2 | 3.4 |
| New York | 2.9 | 3.1 | 3.3 |
| Rhode Island | 2.8 | 3.0 | 3.2 |
| Vermont | 2.7 | 2.9 | 3.1 |
| New Jersey | 2.6 | 2.8 | 3.0 |
| New Hampshire | 2.5 | 2.7 | 2.9 |
| California | 2.4 | 2.6 | 2.8 |
| Maryland | 2.3 | 2.5 | 2.7 |
| Illinois | 2.2 | 2.4 | 2.6 |
| Delaware | 2.1 | 2.3 | 2.5 |
| Washington | 2.0 | 2.2 | 2.4 |
| Oregon | 1.9 | 2.1 | 2.3 |
| Nevada | 1.8 | 2.0 | 2.2 |
| Colorado | 1.7 | 1.9 | 2.1 |
| Michigan | 1.6 | 1.8 | 2.0 |
| Florida | 1.5 | 1.7 | 1.9 |
| Texas | 1.4 | 1.6 | 1.8 |


