Get Access to World’s largest Template Library & Tools

How to Change Y-Axis Values in Microsoft Excel


Microsoft Excel allows for detailed customization of chart elements, including the Y-axis values, to better suit your data analysis needs. Learn to adjust these values, ensuring your charts accurately reflect the scope and scale of your data.
How to Change Y-Axis Values in Microsoft Excel


Adjusting the Y-axis values in Microsoft Excel charts is crucial for accurately representing your data’s scale and range. This guide provides a straightforward method to customize your charts’ Y-axis, enhancing the clarity and effectiveness of your data presentation.

  • Step 1. Select Your Chart

    First, click on the chart whose Y-axis values you wish to change. This action will make the Chart Tools options appear on the Excel ribbon, providing you with the necessary features for chart customization.

  • Step 2. Access the Format Axis Menu

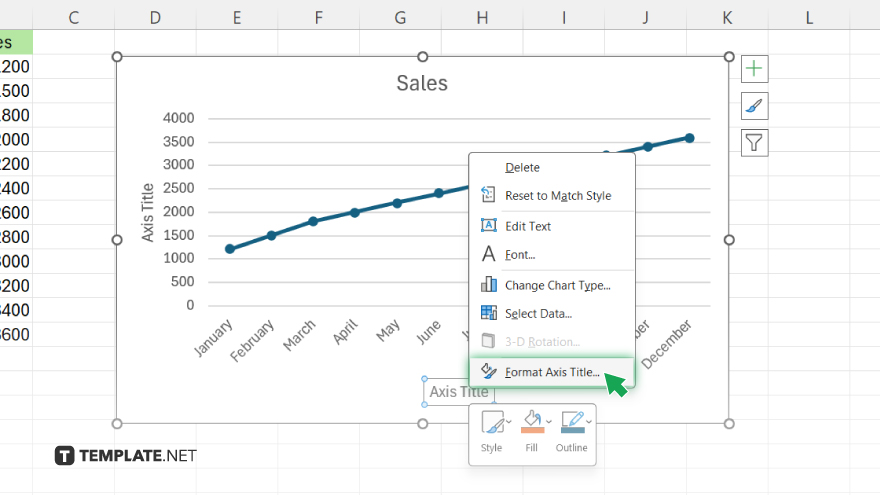
    step 2 access the format axis menu

    With your chart selected, right-click on the Y-axis (the vertical axis) to bring up a context menu. From this menu, select “Format Axis” to open the Format Axis pane on the right side of your screen.

  • Step 3. Adjust the Axis Options

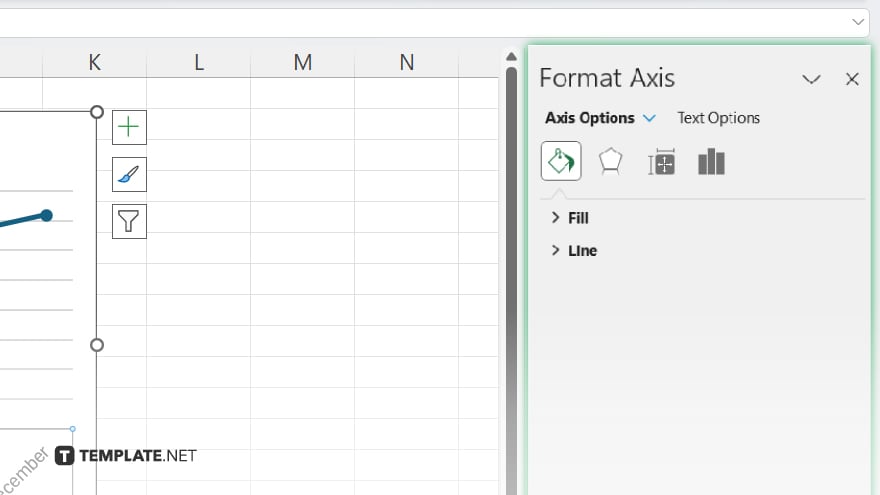
    step 3 adjust the axis options

    In the Format Axis pane, look for the Axis Options section. Here, you can modify the minimum and maximum values of the Y-axis to better match the scale of your data. You can also adjust the axis units, major and minor tick mark types, and where the axis crosses the X-axis.

  • Step 4. Apply Your Changes

    After setting the desired Y-axis values and options, review your changes to ensure they accurately reflect your data’s range and scale. The chart will update automatically as you make adjustments in the Format Axis pane.

  • Step 5. Close the Format Axis Pane

    Once you are satisfied with the adjustments made to the Y-axis values, you can close the Format Axis pane by clicking the “X” in the upper right corner of the pane. Your chart’s Y-axis is now customized to your specifications, making your data presentation more precise and meaningful.

You may also find valuable insights in the following articles offering tips for Microsoft Excel:

note iconNote

Unlock Your Productivity with Over 100,000 Microsoft Excel Templates! Exclusively Available at Template.net – Download Now and Transform Your Data Handling Experience!

FAQs

Can I set the Y-axis values to start from a number other than zero?

Yes, you can customize the starting point of the Y-axis by adjusting the minimum value in the Axis Options.

Is it possible to have the Y-axis on both sides of the chart?

Yes, you can add a secondary Y-axis to the right side of the chart through the “Add Chart Element” menu.

How do I make the Y-axis values display as percentages?

Change the number format to “Percentage” in the Format Axis pane under the Number section.

Can I reverse the order of the Y-axis values in Excel?

Yes, you can reverse the order by checking the “Categories in reverse order” option in the Axis Options.

How do I set specific intervals for Y-axis values?

Adjust the major or minor unit values in the Axis Options to set specific intervals for the Y-axis markings.

More in Excel

How to Change the Microsoft Excel ThemeHow to Learn Microsoft Excel for Free
How to Create Address Labels in Microsoft ExcelHow to Sort a Table in Microsoft Excel
How to Find the Mean, Median, and Mode in Microsoft ExcelHow to Sum Random Cells in Microsoft Excel
How to Add a Whole Column in Microsoft ExcelHow to Make a Copy of a Microsoft Excel Workbook
How to Subtract a Column in Microsoft ExcelHow to Remove Parentheses in Microsoft Excel
How to Fix Rows in Microsoft ExcelHow to Make a Timesheet in Microsoft Excel
How to Create a Flow Chart in Microsoft ExcelHow to Make Square Cells in Microsoft Excel
How to Apply a Filter in Microsoft ExcelHow to Insert a Note in Microsoft Excel
How to Make a Graph in Microsoft Excel With DataHow to Create a Sparkline in Microsoft Excel
How to Set Margins in Microsoft ExcelHow to Copy Filtered Data in Microsoft Excel
How to Set Default Font in Microsoft ExcelHow to Edit Footer in Microsoft Excel
How to Unhide All Sheets in Microsoft ExcelHow to Get Rid of Spaces in Microsoft Excel
How to Calculate Columns in Microsoft ExcelHow to Change a Formula to a Value in Microsoft Excel
How to Flip Rows and Columns in Microsoft ExcelHow to Make a Box in Microsoft Excel
How to Use NPV in Microsoft ExcelHow to Make a List of Numbers in Microsoft Excel
How to Make a Sensitivity Table in Microsoft ExcelHow to Keep 0 in Front of a Number in Microsoft Excel
How to Do an Absolute Reference in Microsoft ExcelHow to Put a Drop Down in Microsoft Excel
How to Change a Negative Number to Positive in ExcelHow to Combine Tables in Microsoft Excel
How to Highlight Blank Cells in Microsoft ExcelHow to Save a Macro in Microsoft Excel
How to Sort by Month in Microsoft ExcelHow to Do a Percentage Increase in Microsoft Excel
How to Apply Filter in Microsoft ExcelHow to Delete Multiple Sheets in Microsoft Excel
How to Create a Slicer in Microsoft ExcelHow to Turn Microsoft Excel Data Into a Graph
How to Move a Page Break in Microsoft ExcelHow to Clear Table Format in Microsoft Excel
How to Extract the Year From a Date in Microsoft ExcelHow to Do a Bar Graph in Microsoft Excel
How to Change Theme in Microsoft ExcelHow to Calculate Cells in Microsoft Excel
How to Label X and Y Axis on Microsoft ExcelHow to Change Print Area in Microsoft Excel
How to Add 2 Cells in Microsoft ExcelHow to Write Vertically in Microsoft Excel
How to Display All Formulas in Microsoft ExcelHow to Change the Chart Style in Microsoft Excel
How to Enter Bullet Points in Microsoft ExcelHow to Change a Microsoft Excel File from Read Only
How to Show the Ribbon in Microsoft ExcelHow to Make a Clustered Column Chart in Excel
How to See Duplicates in Microsoft ExcelHow to Trim in Microsoft Excel
How to Do a Scatter Plot in Microsoft ExcelHow to Switch Cells in Microsoft Excel
How to Calculate Workdays in Microsoft ExcelHow to Make a Macro in Microsoft Excel
How to Create a Sensitivity Table in Microsoft ExcelHow to Calculate a Percentage in Microsoft Excel
How to Freeze 2 Rows in Microsoft ExcelHow to Import a File Into Microsoft Excel
How to Email a Microsoft Excel SheetHow to Create Labels in Word From Microsoft Excel
How to Auto-Adjust Row Height in Microsoft ExcelHow to Combine Tabs in Microsoft Excel
How to Wrap Text in a Microsoft Excel CellHow to Autofill the Date in Microsoft Excel
How to Fix a Circular Reference in Microsoft ExcelHow to Add a Label to an Axis in Microsoft Excel
How to Select a Row in Microsoft ExcelHow to Lock Cells in Microsoft Excel for Scrolling
How to Get Microsoft Excel to Round UpHow to Start a New Paragraph in Microsoft Excel
How to Insert Check Boxes in Microsoft ExcelHow to Change Horizontal Axis Values in Microsoft Excel
How to Enable the Developer Tab in Microsoft ExcelHow to Copy a Row in Microsoft Excel
How to Delete Extra Pages in Microsoft ExcelHow to Change a CSV File to Microsoft Excel
How to Share and Edit Microsoft Excel FilesHow to Find a P-Value in Microsoft Excel
How to Compare Two Microsoft Excel Sheets for DuplicatesHow to Delete a Chart in Microsoft Excel
How to Put Dates in Order on Microsoft ExcelHow to Freeze Both Rows and Columns in Microsoft Excel
How to Recover a Corrupted Microsoft Excel FileHow to Save a Microsoft Excel File as a CSV
How to Unprotect a Microsoft Excel SpreadsheetHow to Add Rows in Microsoft Excel Using a Shortcut
How to Do a Count in Microsoft ExcelHow to Find the Sum of a Column in Microsoft Excel
bottom banner