Free US Mobile Shopping Trends by Income Group from 2015 to 2025 Chart
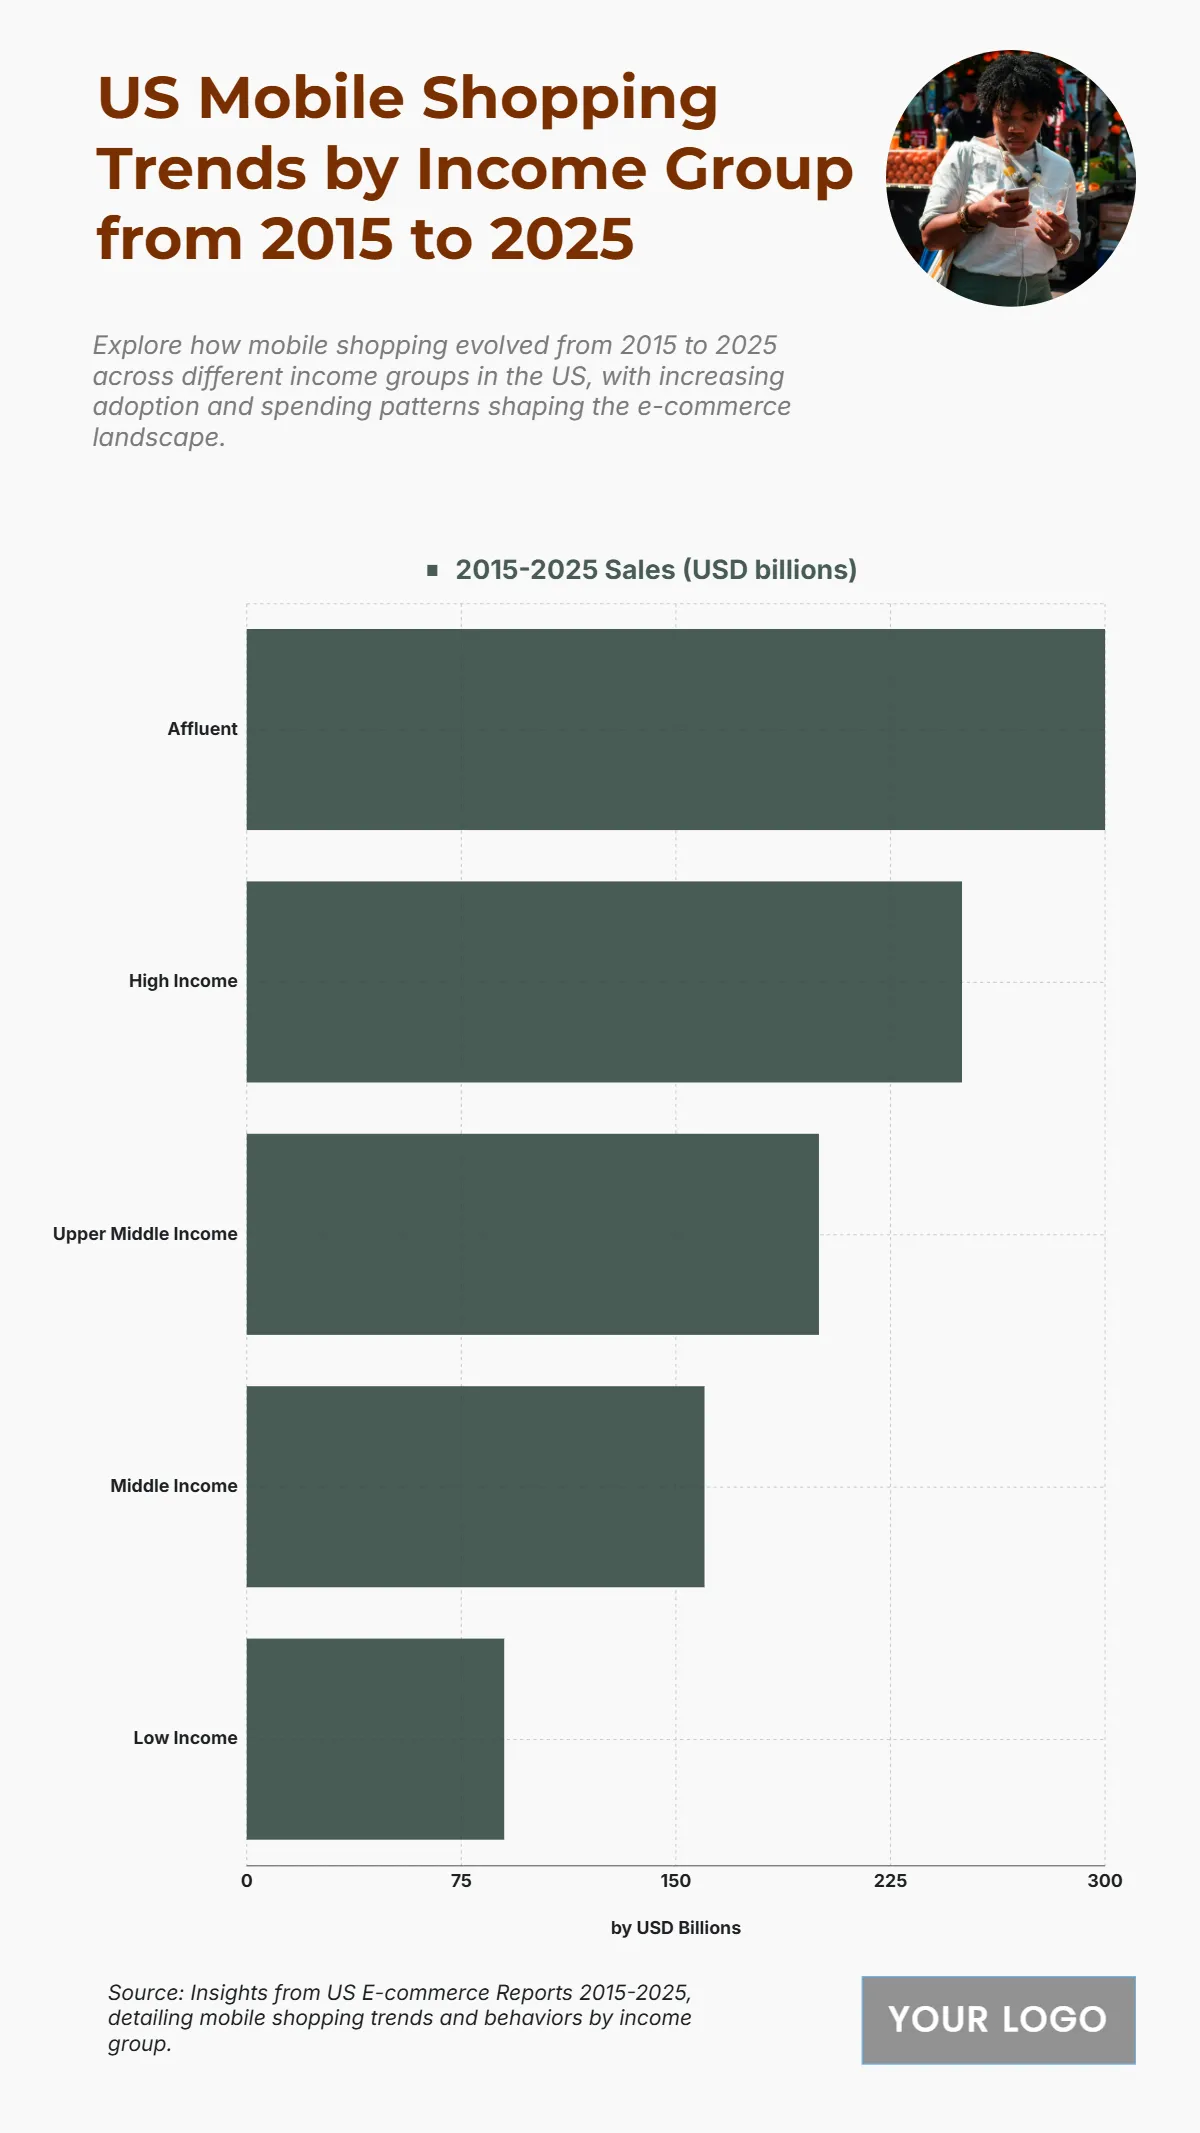
The chart reveals a clear income-based gap in mobile shopping sales in the U.S., showing how higher-income groups drive a significant portion of mobile commerce activity. Affluent consumers lead with USD 300 billion in sales, followed by High Income groups at USD 250 billion and Upper Middle Income at USD 200 billion. Meanwhile, Middle Income accounts for USD 160 billion, and Low Income contributes USD 90 billion. These figures indicate how affluent and high-income groups dominate mobile spending, reflecting both greater purchasing power and stronger adoption of digital retail channels. The steady climb across all income brackets illustrates the broad penetration of mobile commerce, but also emphasizes a notable disparity in total transaction volume between income levels, shaping targeted marketing strategies and platform optimizations.
| Labels | 2015–2025 Sales (USD billions) |
|---|---|
| Affluent | 300 |
| High Income | 250 |
| Upper Middle Income | 200 |
| Middle Income | 160 |
| Low Income | 90 |


