Free Carbon Footprint Flow Chart
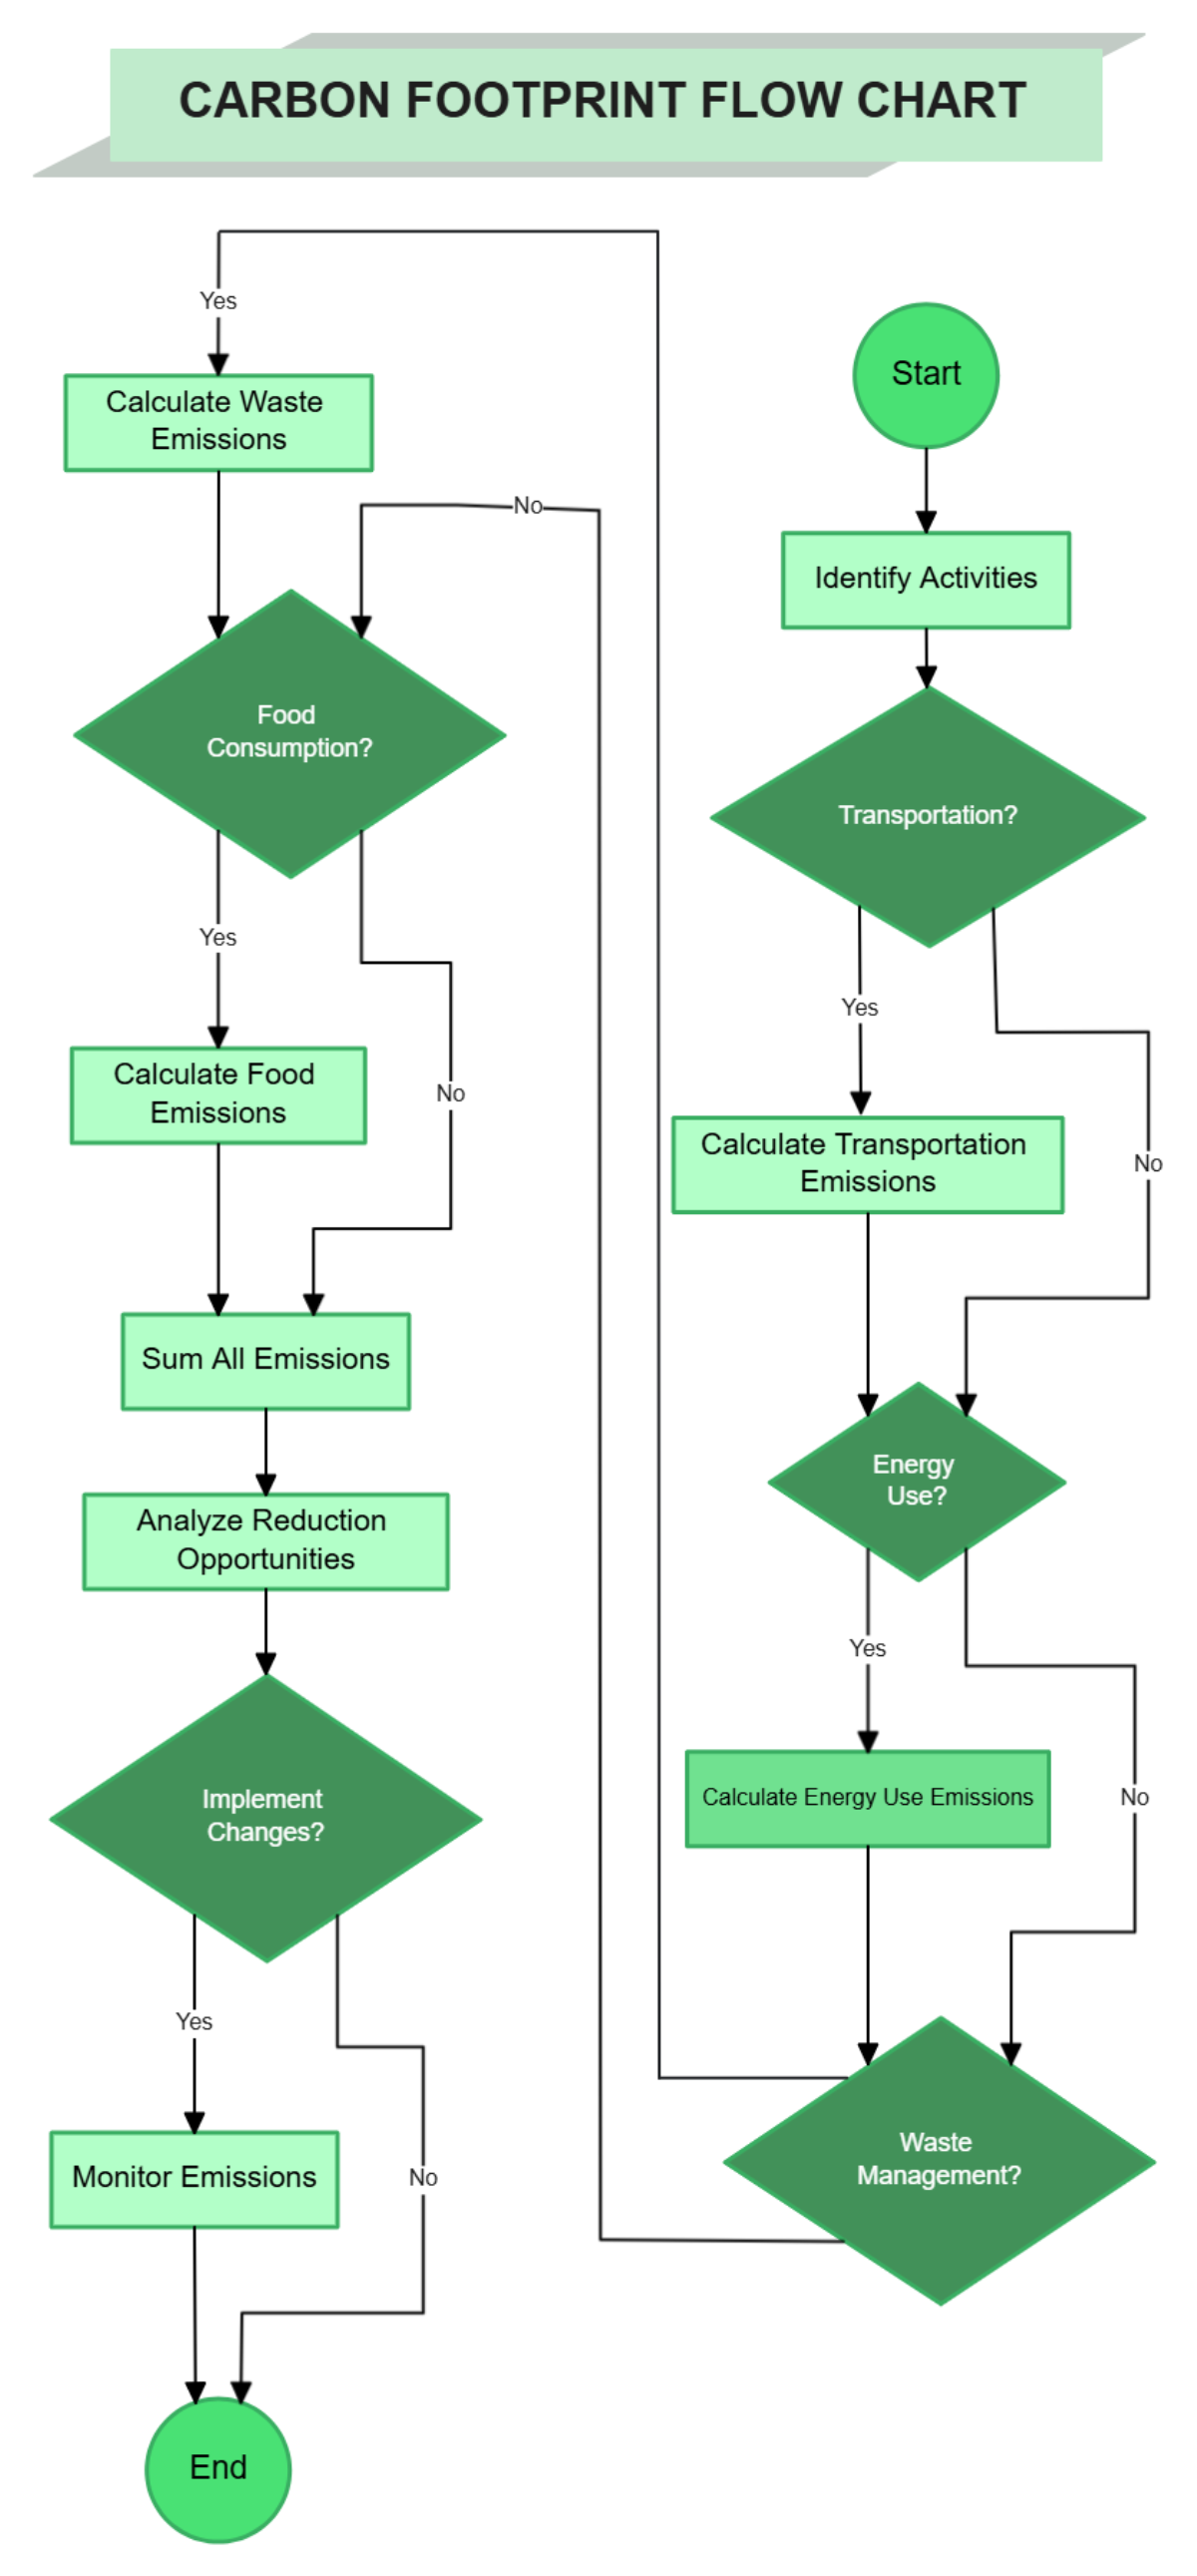
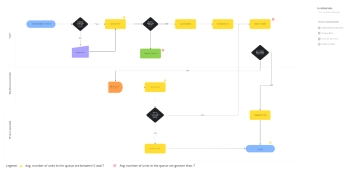
The chart presents a systematic approach to measuring and reducing environmental impact by focusing on key emission sources: transportation, energy use, waste management, and food consumption. It begins with identifying activities that produce emissions, followed by checking if transportation is involved. If yes, transportation emissions are calculated before moving to the next step. Similarly, energy usage is assessed, triggering the calculation of energy use emissions, while waste management leads to computing waste emissions. If food consumption exists, it further calculates food-related emissions. All these calculations converge at “Sum All Emissions”, providing a comprehensive view of total carbon output. This total becomes the basis for analyzing reduction opportunities, identifying areas for optimization or change. If feasible, changes are implemented — whether through sustainable energy sources, waste reduction, or transportation shifts. The final stage involves monitoring emissions to ensure reductions are effective over time. Decision diamonds like “Transportation?” or “Food Consumption?” allow for skipping unnecessary steps, making the process adaptable to different scenarios. The structured flow ensures that no emission category is overlooked, guiding organizations or individuals toward measurable and continuous carbon reduction strategies. By looping back to activity identification, it reinforces that environmental responsibility is an ongoing cycle of evaluation, action, and monitoring, not a one-time task.
