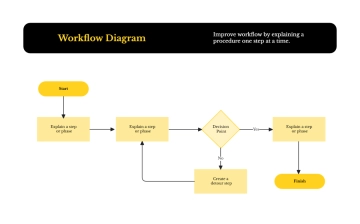
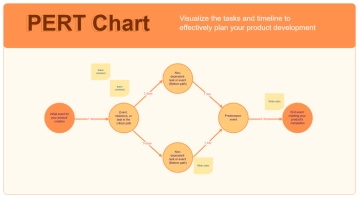
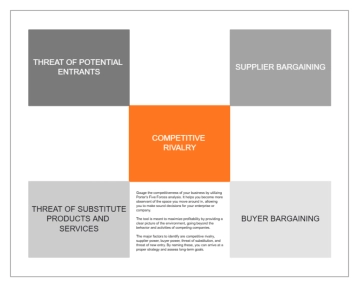
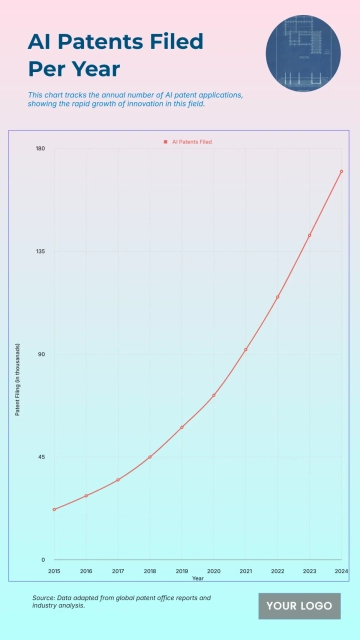
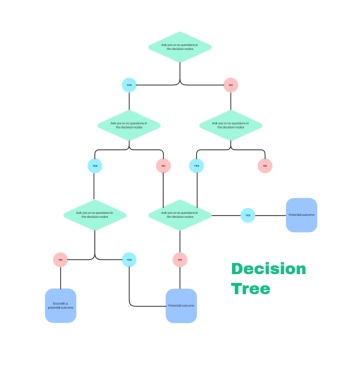
A professional 3:2 chart for mapping how a blockchain transaction is processed, professionally designed by Template.net, with yellow decision diamonds, process boxes and connecting arrows in golden yellow, white and dark brown.
A professional 3:2 chart for mapping how a blockchain transaction is processed, professionally designed by Template.net, with yellow decision diamonds, process boxes and connecting arrows in golden yellow, white and dark brown.