Get Access to World’s largest Template Library & Tools

How to Do a Correlation in Microsoft Excel

Microsoft Excel provides advanced features for statistical analysis, including the ability to perform correlation calculations. Study how to efficiently use Excel to determine the correlation coefficient, helping you understand the strength and direction of relationships between two data sets.
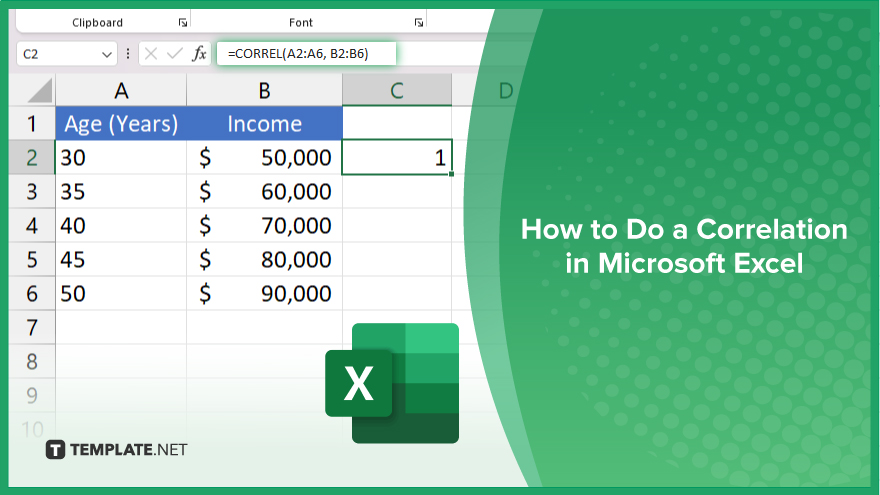
How to Do a Correlation in Microsoft Excel


In Microsoft Excel, performing a correlation analysis helps you understand the relationship between two sets of data. Follow these steps to calculate the correlation coefficient effectively:

  • Step 1. Prepare Your Data

    Start by organizing your data into two clear, adjacent columns. Each column should represent one variable, with matching data points in the same rows across the two columns.

  • Step 2. Insert a Correlation Function

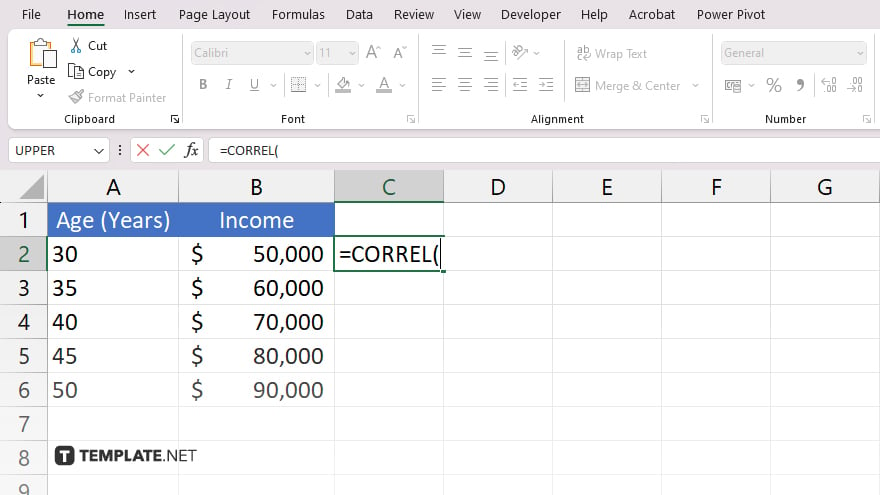
    step 2 insert a correlation function

    Select an empty cell in your sheet where you want the correlation result to appear. Type “=CORREL(” to begin entering the correlation function.

  • Step 3. Select the Data Ranges

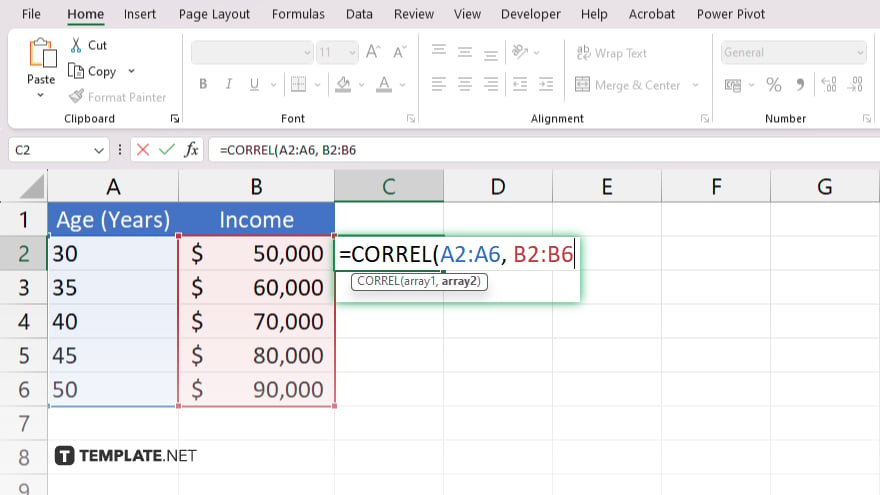
    step 3 select the data ranges

    Click and drag to select the range of cells for your first data set, add a comma, and then select the range for your second data set. Your function should look like “=CORREL(A2:A10, B2:B10),” assuming your data is in columns A and B.

  • Step 4. Complete the Function

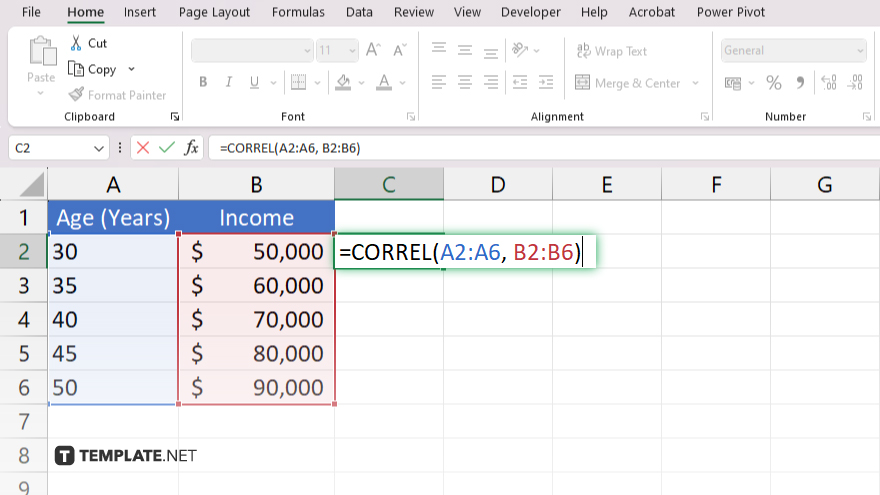
    step 4 complete the function

    After selecting the data ranges, type “)” to close the function and press “Enter.” Excel will compute the correlation coefficient, indicating the strength and direction of the relationship between the two data sets.

  • Step 5. Analyze the Result

    The correlation coefficient will appear in the cell you selected. Interpret this value to understand the relationship: values closer to 1 or -1 indicate a strong positive or negative correlation, respectively, while values near 0 suggest a weak or no correlation.

You may also find valuable insights in the following articles offering tips for Microsoft Excel:

note iconNote

Unlock Your Productivity with Over 100,000 Microsoft Excel Templates! Exclusively Available at Template.net – Download Now and Transform Your Data Handling Experience!

FAQs

What does the correlation coefficient tell us?

The correlation coefficient indicates the strength and direction of a linear relationship between two variables, with values ranging from -1 to 1.

Can I perform a correlation on more than two variables at once in Excel?

Yes, you can use the Data Analysis Toolpak in Excel to perform correlation analysis on multiple variables simultaneously.

What should I do if I get an error when calculating correlation?

Ensure that both data ranges are of equal length, contain only numeric values, and have no missing or non-numeric entries.

Is there a way to visualize the correlation in Excel?

Yes, you can create a scatter plot in Excel to assess the correlation between the two variables visually.

How accurate is Excel’s correlation function compared to specialized statistical software?

Excel’s CORREL function is generally accurate for basic correlation analysis but specialized statistical software may offer more advanced features and greater precision for complex data sets.

More in Excel

How to Change the Microsoft Excel ThemeHow to Learn Microsoft Excel for Free
How to Create Address Labels in Microsoft ExcelHow to Sort a Table in Microsoft Excel
How to Find the Mean, Median, and Mode in Microsoft ExcelHow to Sum Random Cells in Microsoft Excel
How to Add a Whole Column in Microsoft ExcelHow to Make a Copy of a Microsoft Excel Workbook
How to Subtract a Column in Microsoft ExcelHow to Remove Parentheses in Microsoft Excel
How to Fix Rows in Microsoft ExcelHow to Make a Timesheet in Microsoft Excel
How to Create a Flow Chart in Microsoft ExcelHow to Make Square Cells in Microsoft Excel
How to Apply a Filter in Microsoft ExcelHow to Insert a Note in Microsoft Excel
How to Make a Graph in Microsoft Excel With DataHow to Create a Sparkline in Microsoft Excel
How to Set Margins in Microsoft ExcelHow to Copy Filtered Data in Microsoft Excel
How to Set Default Font in Microsoft ExcelHow to Edit Footer in Microsoft Excel
How to Unhide All Sheets in Microsoft ExcelHow to Get Rid of Spaces in Microsoft Excel
How to Calculate Columns in Microsoft ExcelHow to Change a Formula to a Value in Microsoft Excel
How to Flip Rows and Columns in Microsoft ExcelHow to Make a Box in Microsoft Excel
How to Use NPV in Microsoft ExcelHow to Make a List of Numbers in Microsoft Excel
How to Make a Sensitivity Table in Microsoft ExcelHow to Keep 0 in Front of a Number in Microsoft Excel
How to Do an Absolute Reference in Microsoft ExcelHow to Put a Drop Down in Microsoft Excel
How to Change a Negative Number to Positive in ExcelHow to Combine Tables in Microsoft Excel
How to Highlight Blank Cells in Microsoft ExcelHow to Save a Macro in Microsoft Excel
How to Sort by Month in Microsoft ExcelHow to Do a Percentage Increase in Microsoft Excel
How to Apply Filter in Microsoft ExcelHow to Delete Multiple Sheets in Microsoft Excel
How to Create a Slicer in Microsoft ExcelHow to Turn Microsoft Excel Data Into a Graph
How to Move a Page Break in Microsoft ExcelHow to Clear Table Format in Microsoft Excel
How to Extract the Year From a Date in Microsoft ExcelHow to Do a Bar Graph in Microsoft Excel
How to Change Theme in Microsoft ExcelHow to Calculate Cells in Microsoft Excel
How to Label X and Y Axis on Microsoft ExcelHow to Change Print Area in Microsoft Excel
How to Add 2 Cells in Microsoft ExcelHow to Write Vertically in Microsoft Excel
How to Display All Formulas in Microsoft ExcelHow to Change the Chart Style in Microsoft Excel
How to Enter Bullet Points in Microsoft ExcelHow to Change a Microsoft Excel File from Read Only
How to Show the Ribbon in Microsoft ExcelHow to Make a Clustered Column Chart in Excel
How to See Duplicates in Microsoft ExcelHow to Trim in Microsoft Excel
How to Do a Scatter Plot in Microsoft ExcelHow to Switch Cells in Microsoft Excel
How to Calculate Workdays in Microsoft ExcelHow to Make a Macro in Microsoft Excel
How to Create a Sensitivity Table in Microsoft ExcelHow to Calculate a Percentage in Microsoft Excel
How to Freeze 2 Rows in Microsoft ExcelHow to Import a File Into Microsoft Excel
How to Email a Microsoft Excel SheetHow to Create Labels in Word From Microsoft Excel
How to Auto-Adjust Row Height in Microsoft ExcelHow to Combine Tabs in Microsoft Excel
How to Wrap Text in a Microsoft Excel CellHow to Autofill the Date in Microsoft Excel
How to Fix a Circular Reference in Microsoft ExcelHow to Add a Label to an Axis in Microsoft Excel
How to Select a Row in Microsoft ExcelHow to Lock Cells in Microsoft Excel for Scrolling
How to Get Microsoft Excel to Round UpHow to Start a New Paragraph in Microsoft Excel
How to Insert Check Boxes in Microsoft ExcelHow to Change Horizontal Axis Values in Microsoft Excel
How to Enable the Developer Tab in Microsoft ExcelHow to Copy a Row in Microsoft Excel
How to Delete Extra Pages in Microsoft ExcelHow to Change a CSV File to Microsoft Excel
How to Share and Edit Microsoft Excel FilesHow to Find a P-Value in Microsoft Excel
How to Compare Two Microsoft Excel Sheets for DuplicatesHow to Delete a Chart in Microsoft Excel
How to Put Dates in Order on Microsoft ExcelHow to Freeze Both Rows and Columns in Microsoft Excel
How to Recover a Corrupted Microsoft Excel FileHow to Save a Microsoft Excel File as a CSV
How to Unprotect a Microsoft Excel SpreadsheetHow to Add Rows in Microsoft Excel Using a Shortcut
How to Do a Count in Microsoft ExcelHow to Find the Sum of a Column in Microsoft Excel
bottom banner