Waterfall Chart Template – 9+ Free Sample, Example, Format Download!
A waterfall chart is an important analysis aide in any business meeting. The purpose of this business chart template is to clarify how initial value of something is getting affected or influenced by some sequentially introduced intermediate negative or positive values. It’s especially meant to explain or understand gradual transition of quantitative value of some entity which has been subjected to decrement or increment. You may also like PowerPoint Chart Templates
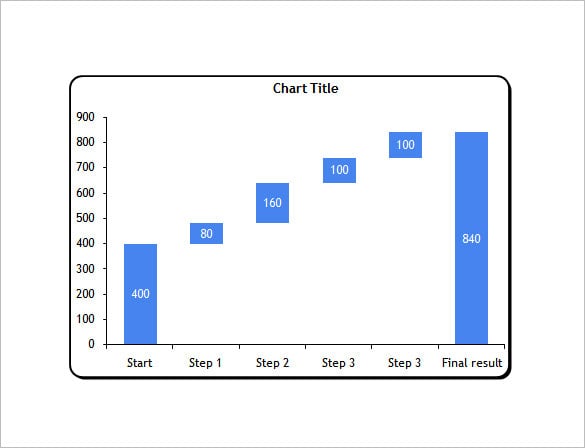
sixteenseven.com | The waterfall chart is an intuitive chart that is used to show the resource allocated to each stage of the project, the initial resource requirement at the start and the final resource requirement.
Sample Solvency Waterfall Chart Free Download
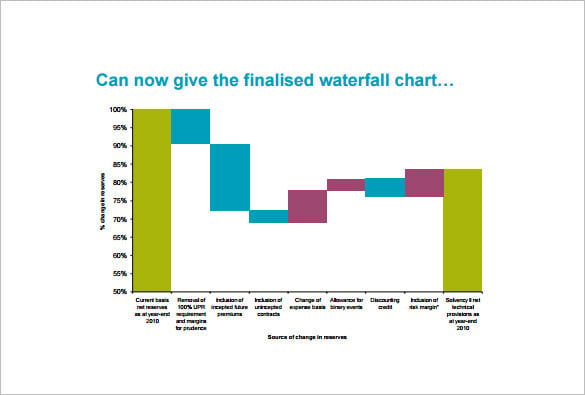
lloyds.com | The solvency waterfall chart denotes the solvency of the company. It shows whether the company is able to meet its long term financial commitments. Different colors are used to indicate the increase and decrease of resources.
Risk Waterfall Chart Sample Word Download
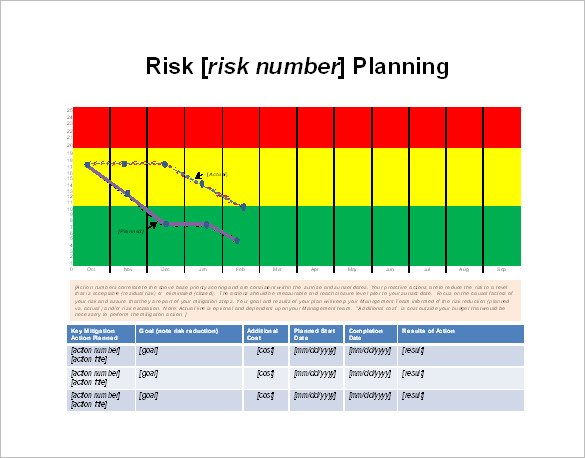
nasa.gov | The risk waterfall chart is a waterfall chart that is used to find the risk number associated with a project. It finds the risk number of different project so that the company can opt for a project with low risk.
Stacked Waterfall Chart Sample PDF Template
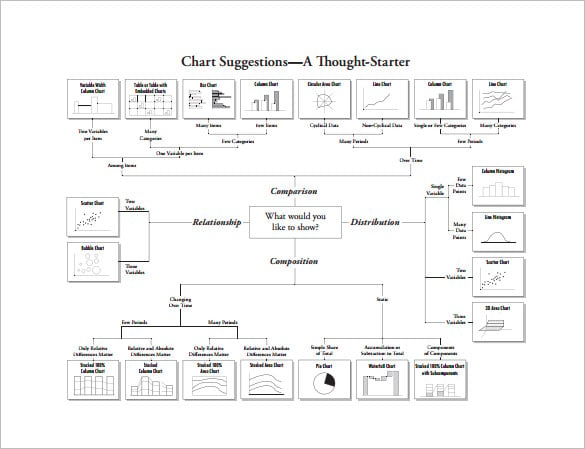
extremepresentation.typepad.com
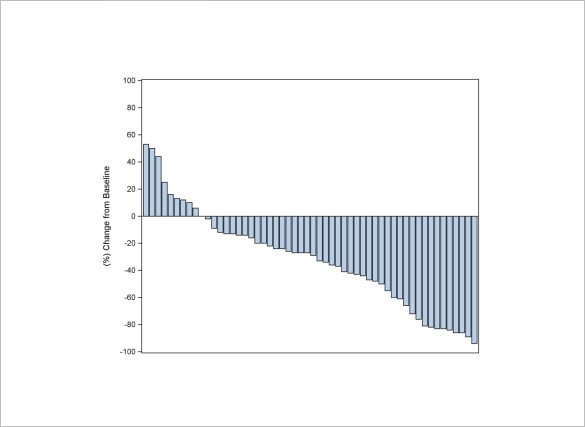
lexjansen.com
example of a Waterfall Chart Template
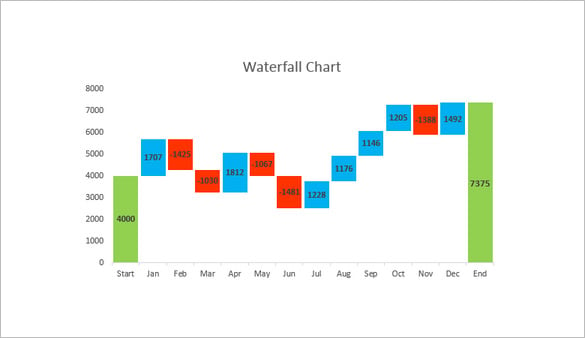
The waterfall chart template is a simple colorful chart that indicates the profit and loss of a company throughout the year. The blue color indicates profit and the red color indicates loss.
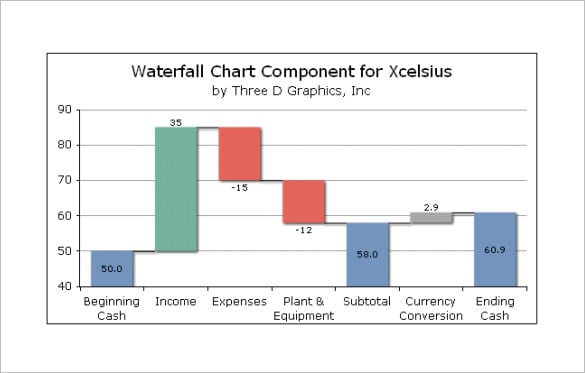
threedgraphics.com The format of waterfall chart is a waterfall chart that can be effectively used to indicate the profit and loss of the company over the different phases of the project.
Sample of a Waterfall Chart Template Download
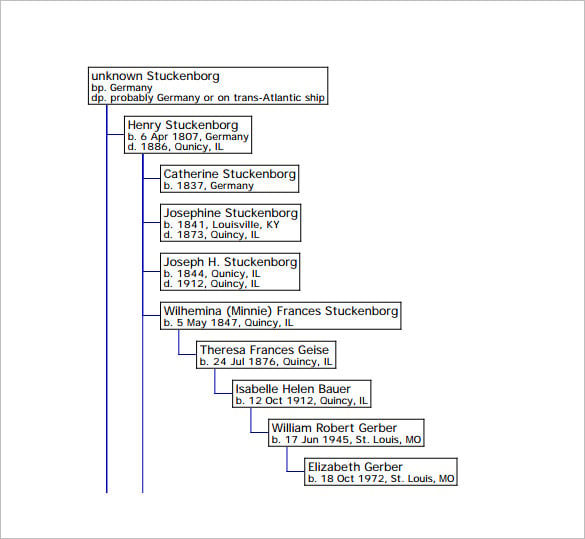
jamiepoindexter.net
A waterfall chart template format is represented by columns. Whole columns are used to mean initial & final values while floating columns signify intermediate values. The columns on the Chart Templates would be color-coded to distinguish between the negative and positive values.
More in Charts
| 31+ Pedigree Chart Templates - PDF, DOC, Excel | 8+ Partnership Organizational Chart Templates in PDF | Word | Google Docs | Pages |
| 10+ Seating Plan Templates in AI | InDesign | PSD | Publisher | Word | Pages | Docs | PDF | 10+ Height And Weight Conversion Chart Templates in Illustrator | PDF |
| 14+ Color Wheel Chart Templates | 10+ Family Tree Organization Chart in Docs | Word | Pages | Editable PDF | Excel | Numbers | PDF |
| FREE 10+ Research Gantt Chart Templates in PDF | MS Word | FREE 5+ Research Process Flow Chart Templates in PDF | MS Word |
| 18+ Research Flow Chart Templates in PDF | MS Word | 10+ Family Tree Chart in Google Docs | Word | Pages | Excel | Numbers | Keynotes | Powerpoint | Editable PDF | PDF |
| 10+ Office Gantt Chart Templates in PDF | Google Sheets | Word | Excel | Pages | Numbers | Classroom Seating Chart Template - 25+ Word, Excel, PDF Format Download! |
| 17+ Office Flowchart Templates in PDF | 10+ Church Organizational Chart Templates in PDF | DOC |
| 5+ Nursing Organizational Chart Templates in PDF | 33+ Company Organizational Chart Templates in Google Docs | Word | Pages | Excel | PDF |
| 7+ Real Estate Organization Chart Templates in Word | Apple Pages | Powerpoint | Keynote | Google Slides | Google Docs | PDF | 8+ Expense Chart Templates in PDF |
| 19+ Management Chart Templates | 15+ Management Flow Chart Templates in PDF |
| 16+ Training Flow Chart Templates in Google Docs | Word | Pages | PDF | 6+ Payroll Flowchart Templates in PDF | DOC |
| 11+ Construction Organisational Chart Templates in Google Docs | Word | Pages | PDF | 7+ Finance Organizational Chart Templates in Google Docs | Word | Pages | PDF |
| 6+ Agency Organizational Chart Templates in Google Docs | Word | Pages | PDF | 12+ Office Organizational Chart Templates in Google Docs | Word | Pages | PDF |
| 14+ School Organizational Chart Templates in Google Docs | Word | Pages | PDF | 12+ Technology Organizational Chart Templates in Google Docs | Word | Pages | PDF |
| 15+ IT Organizational Chart Templates in Google Docs | Word | Pages | PDF | 4+ Marketing Organizational Chart Templates in Google Docs | Word | Pages | PDF |
| 16+ Simple Chart Templates in Google Docs | Word | AI | InDesign | PSD | Publisher | Pages | PDF | XLS | 22+ Department Chart Templates in Google Docs | Word | Pages | PDF |
| 11+ Education Organizational Chart Templates in Google Docs | Words | Pages | Numbers | PDF | XLS | 15+ Company Chart Templates in Google Docs | Word | Pages | PDF |
| 13+ Daily Chart Templates in Google Docs | Word | Pages | PDF | XLS | 10+ Fundraising Chart Templates |
| 14+ Seating Chart Templates | 5+ Workflow Chart Templates |
| 11+ Weekly Chart Templates | 3+ Mind Map Chart Templates |
| 5+ Kid's Chart Templates | 18+ Chore Chart Templates |
| 20+ Comparison Chart Templates | 29+ Timeline Chart Templates |
| 18+ Flow Chart Templates | 9+ Monthly Chart Templates |
| 24+ Organizational Chart Templates | 15+ Growth Chart Templates |
| 15+ Timeline Chart Templates | 16+ Incident Flow Chart Templates |
| 10+ Excel Chart Templates | 7+ Excel Chart Templates |
| 13+ Project Flow Chart Templates | 7+ Marketing Gantt Chart Templates in PDF |
| 8+ Family Genogram Templates | 9+ Marketing Flow Chart Templates in Google Docs | Word | Page | PDF |
| 13+ Simple Wedding Seating Chart Templates | 7+ Wedding Timeline Templates |
| 6+ Sales Chart Templates | 5+ Sales Flowchart Templates |
| How to Create a Flowchart [10+ Templates to Download] | 10+ Flow Chart Templates in Apple Pages |
| 17+ Flow Chart Templates in Google Docs | 10+ Flow Chart Templates in PDF |
| 10+ Flow Chart Templates in Word | 10+ Chart Templates in Google Sheets |
| 12+ Seating Chart Templates | 12+ Seating Chart Templates in Word |
| 17+ Seating Chart Templates in Google Docs | 10+ Chart Templates in Apple Numbers |
| 10+ Chart Templates in Excel | 10+ Chart Templates in Google Docs |
| 11+ Chart Templates in Apple Pages | 10+ Chart Templates in PDF |
| 10+ Chart Templates in Word | 12+ Gantt Chart Templates |
| FREE 12+ Seating Chart Templates in Word | Publisher | inDesign | Photoshop |Illustrator | 13+ Timeline Chart Templates |
| 13+ Chore Chart Templates | 10+ Flow Chart Templates |
| 10+ Chart Templates | 5+ Banner Seating Chart Designs & Templates - PSD, AI |
| 3+ Navy Seating Chart Designs & Templates - PSD, AI | Acrylic Seating Chart Templates - PSD, AI |
| World Seating Chart Templates - PSD, AI | 5+ Photo Seating Chart Designs & Templates - PSD, AI |
| 3+ Travel Seating Chart Designs & Templates - PSD, AI | 4+ Gold Seating Chart Designs & Templates - PSD |
| 3+ Floral Seating Chart Designs & Templates - PSD, AI | 9+ Guest Seating Chart Designs & Templates - PSD, AI |
| 11+ Modern Seating Chart Designs & Templates - PSD, AI | 10+ Wedding Seating Chart Templates |
| Free Potty Training Chart Templates | 16 Temperature Chart Templates- Samples, Examples |
| 6 Table Chart Templates - Samples, Examples | How to Use Excel Chart Templates |
| 33 Sample Flow Chart Templates | 8 Chord Chart Templates - Samples, Examples |
| What Is a Gantt Chart Template? | 6 Music Chart Templates - PDF |


