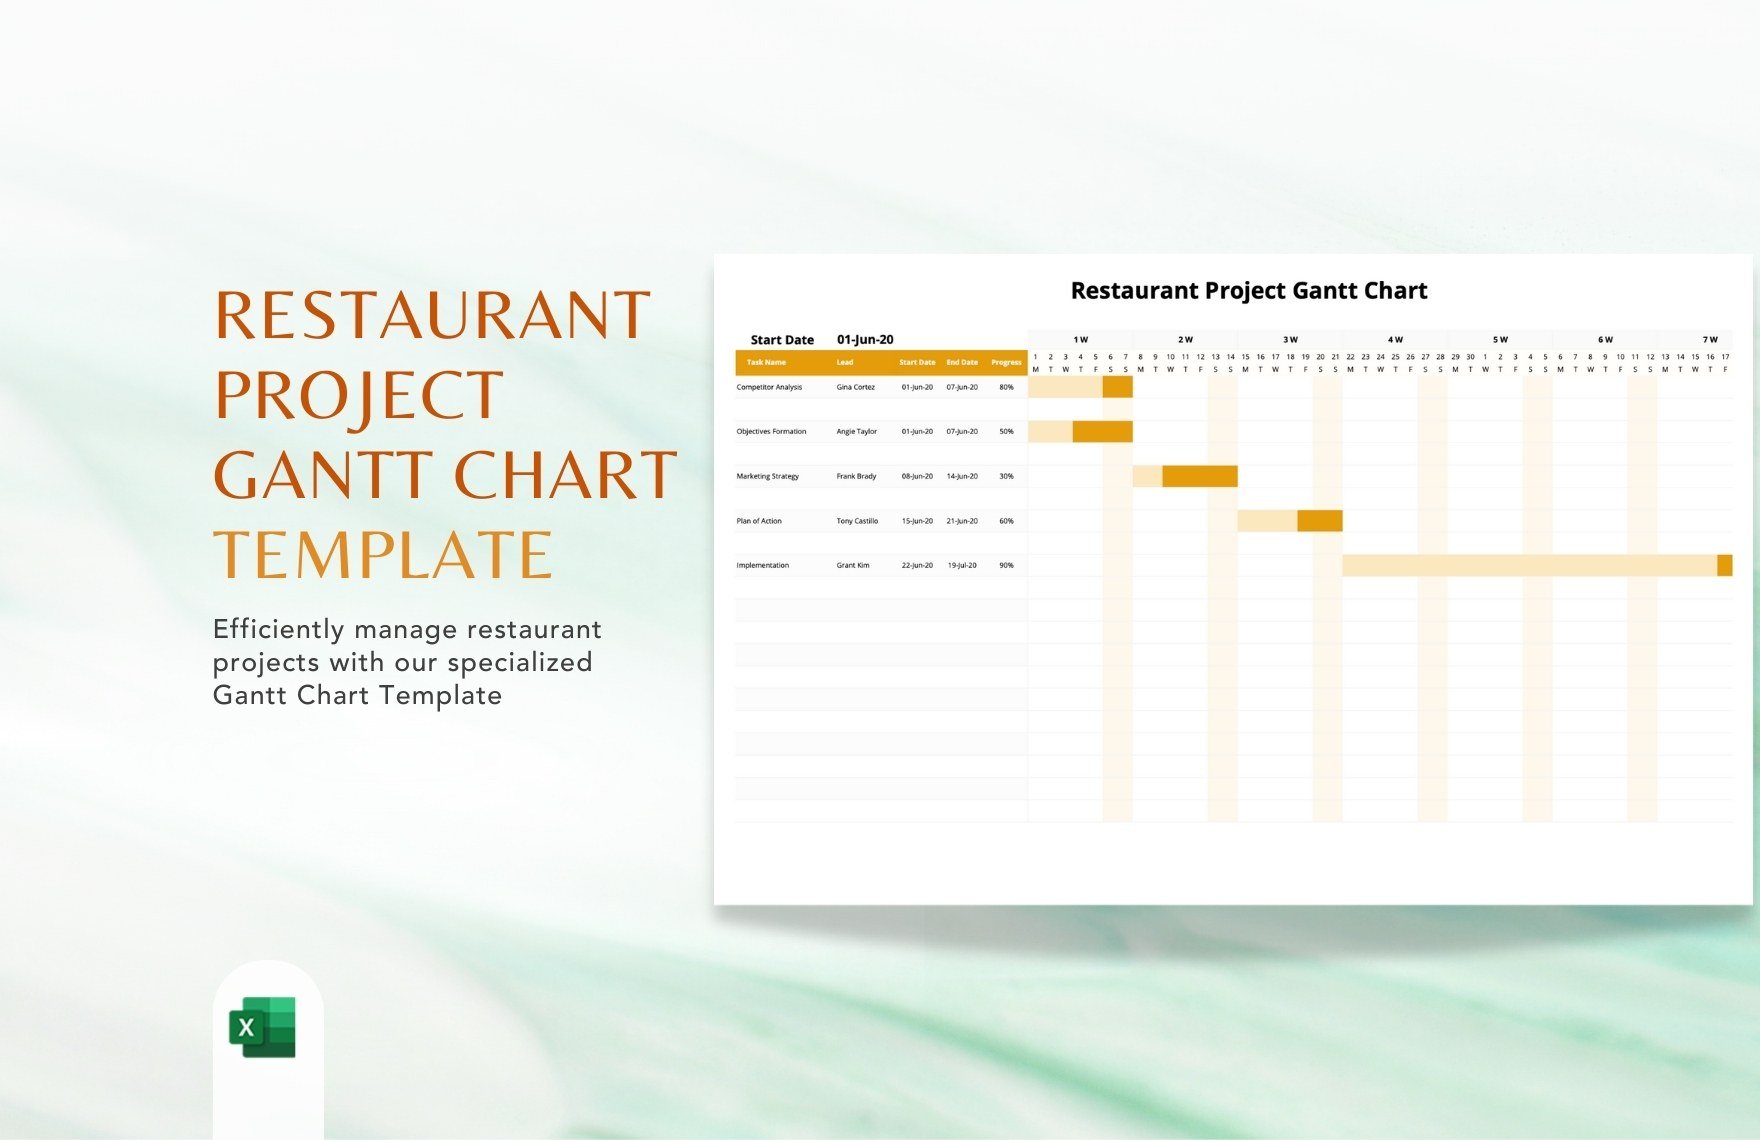
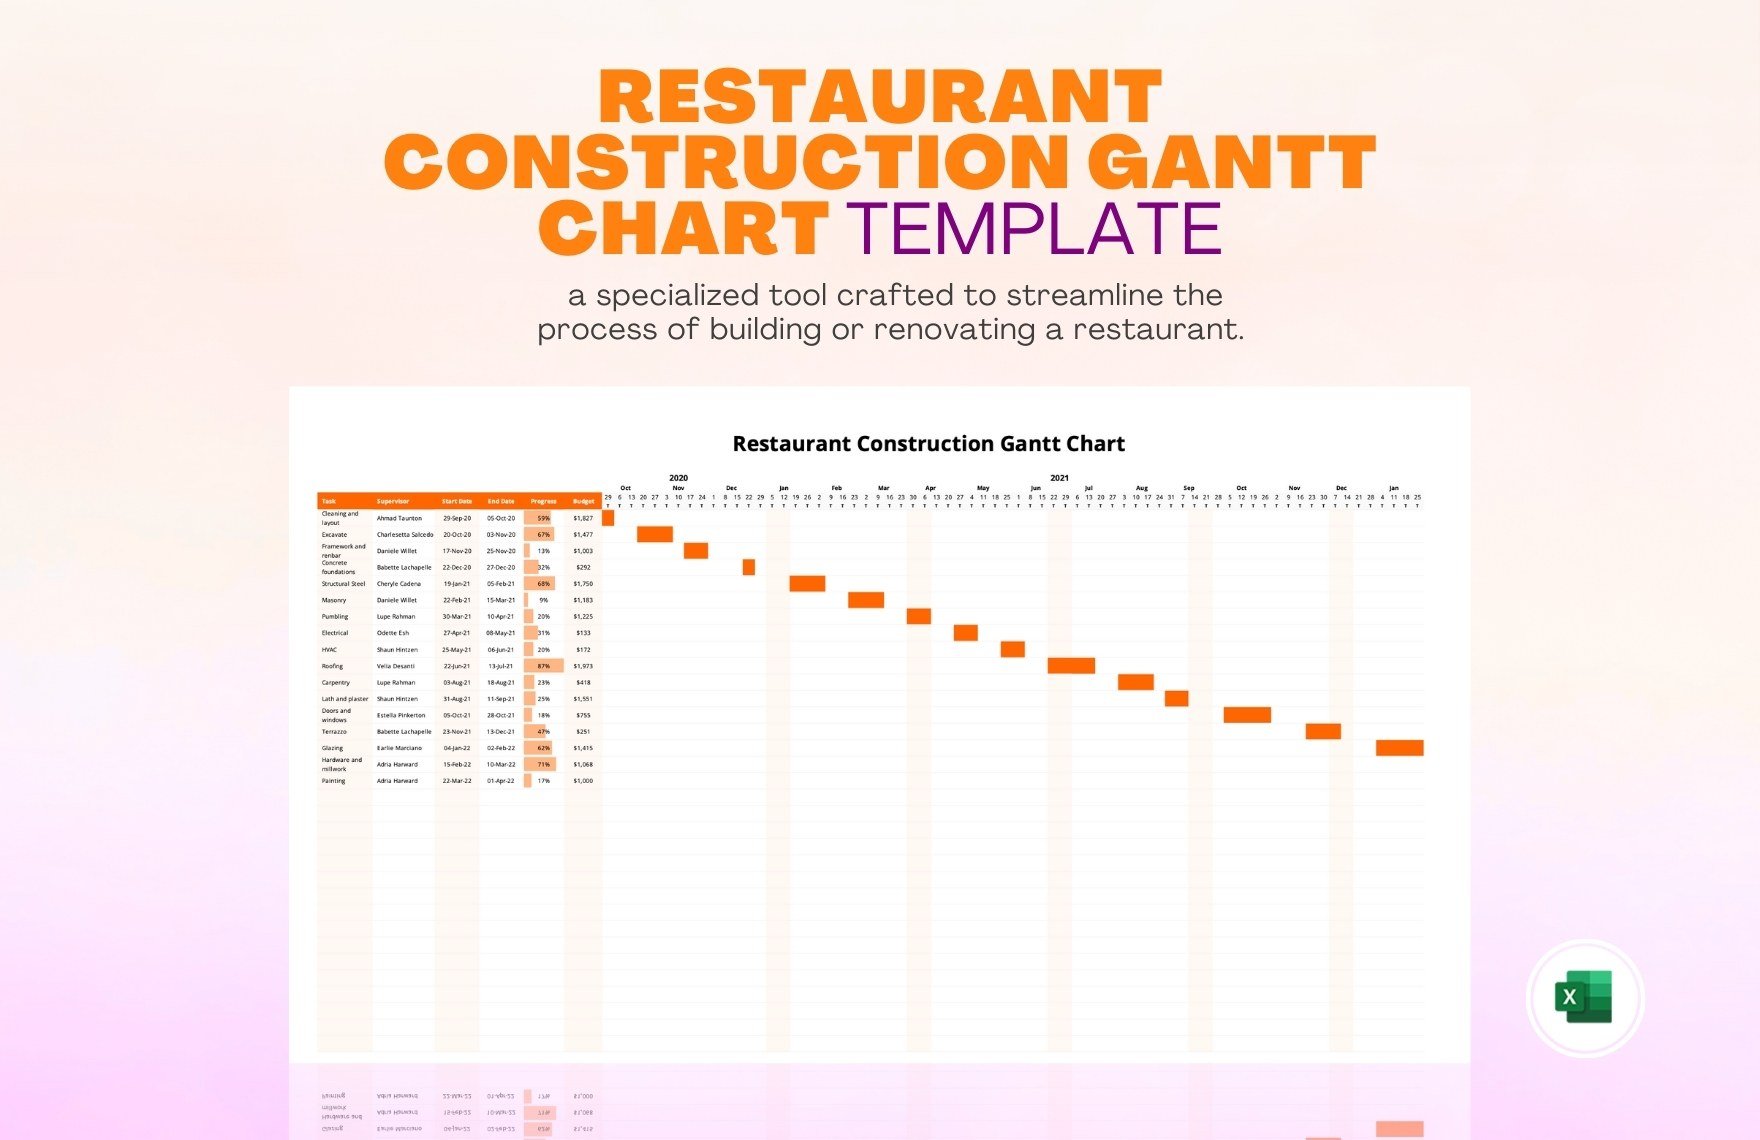
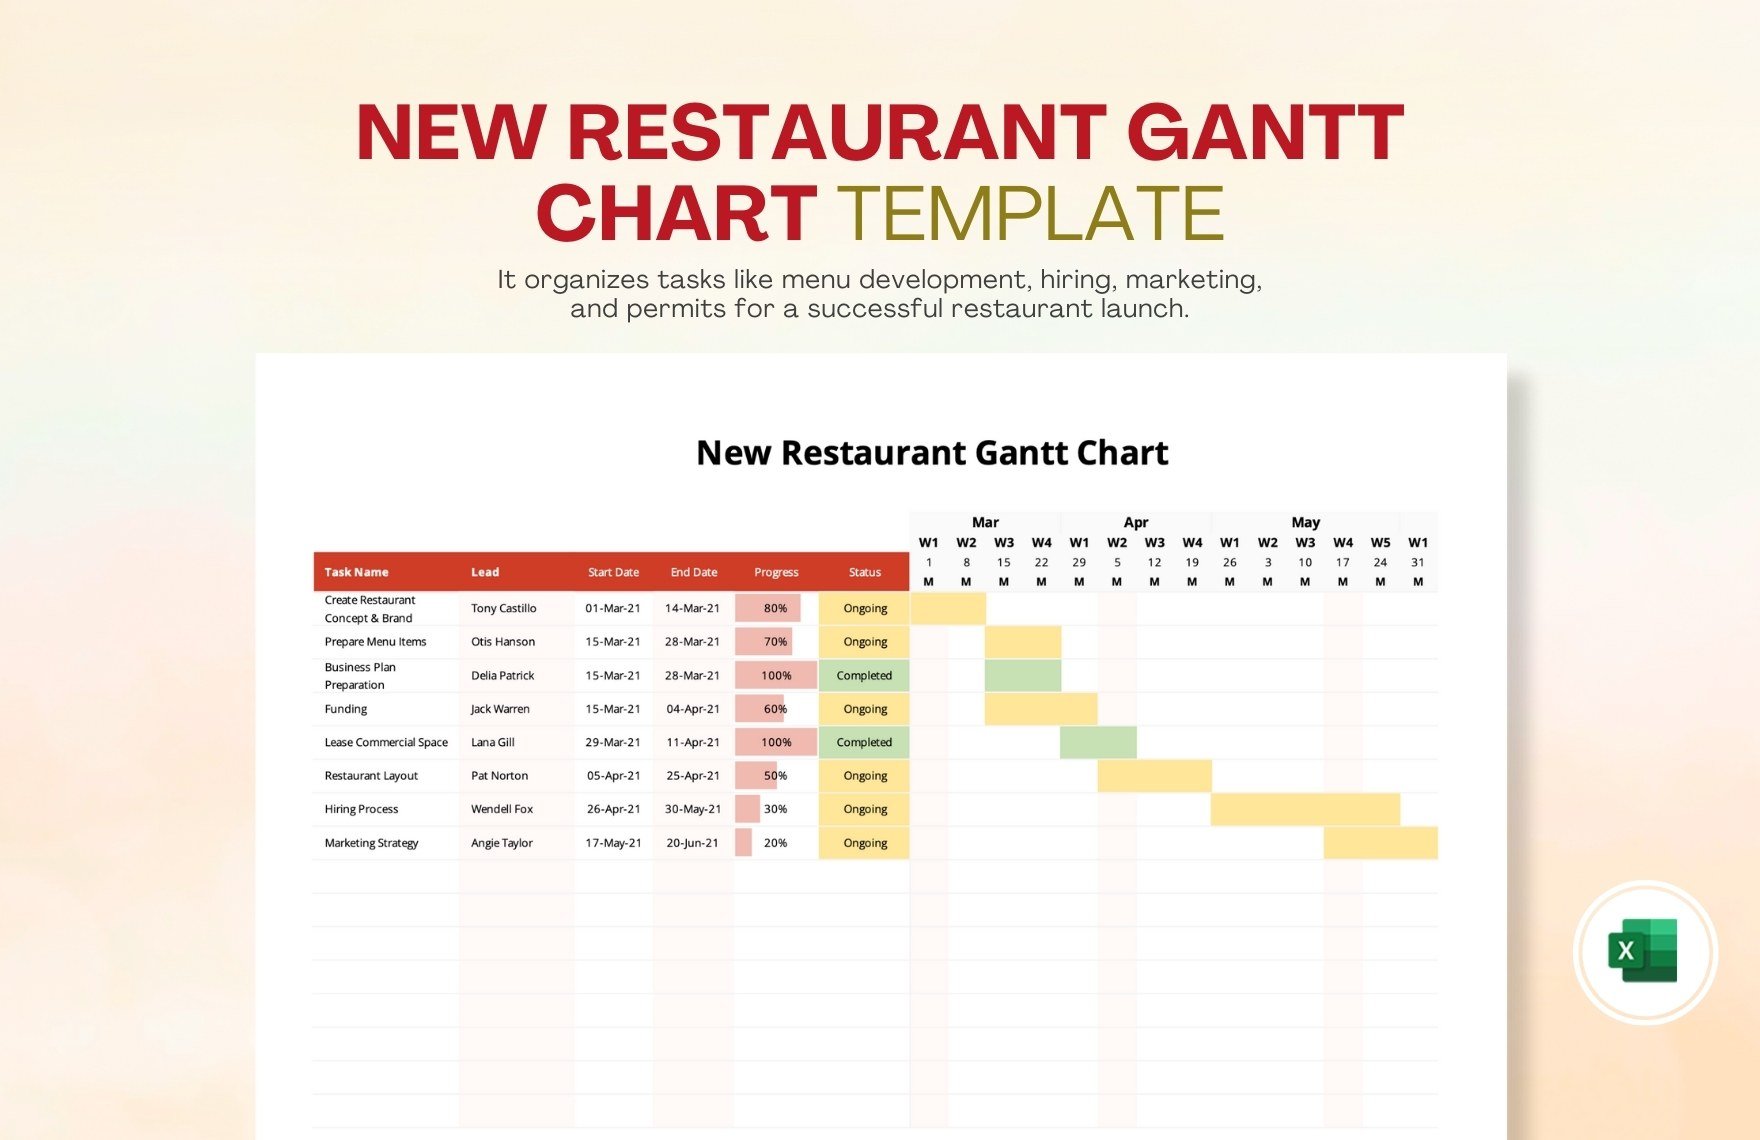
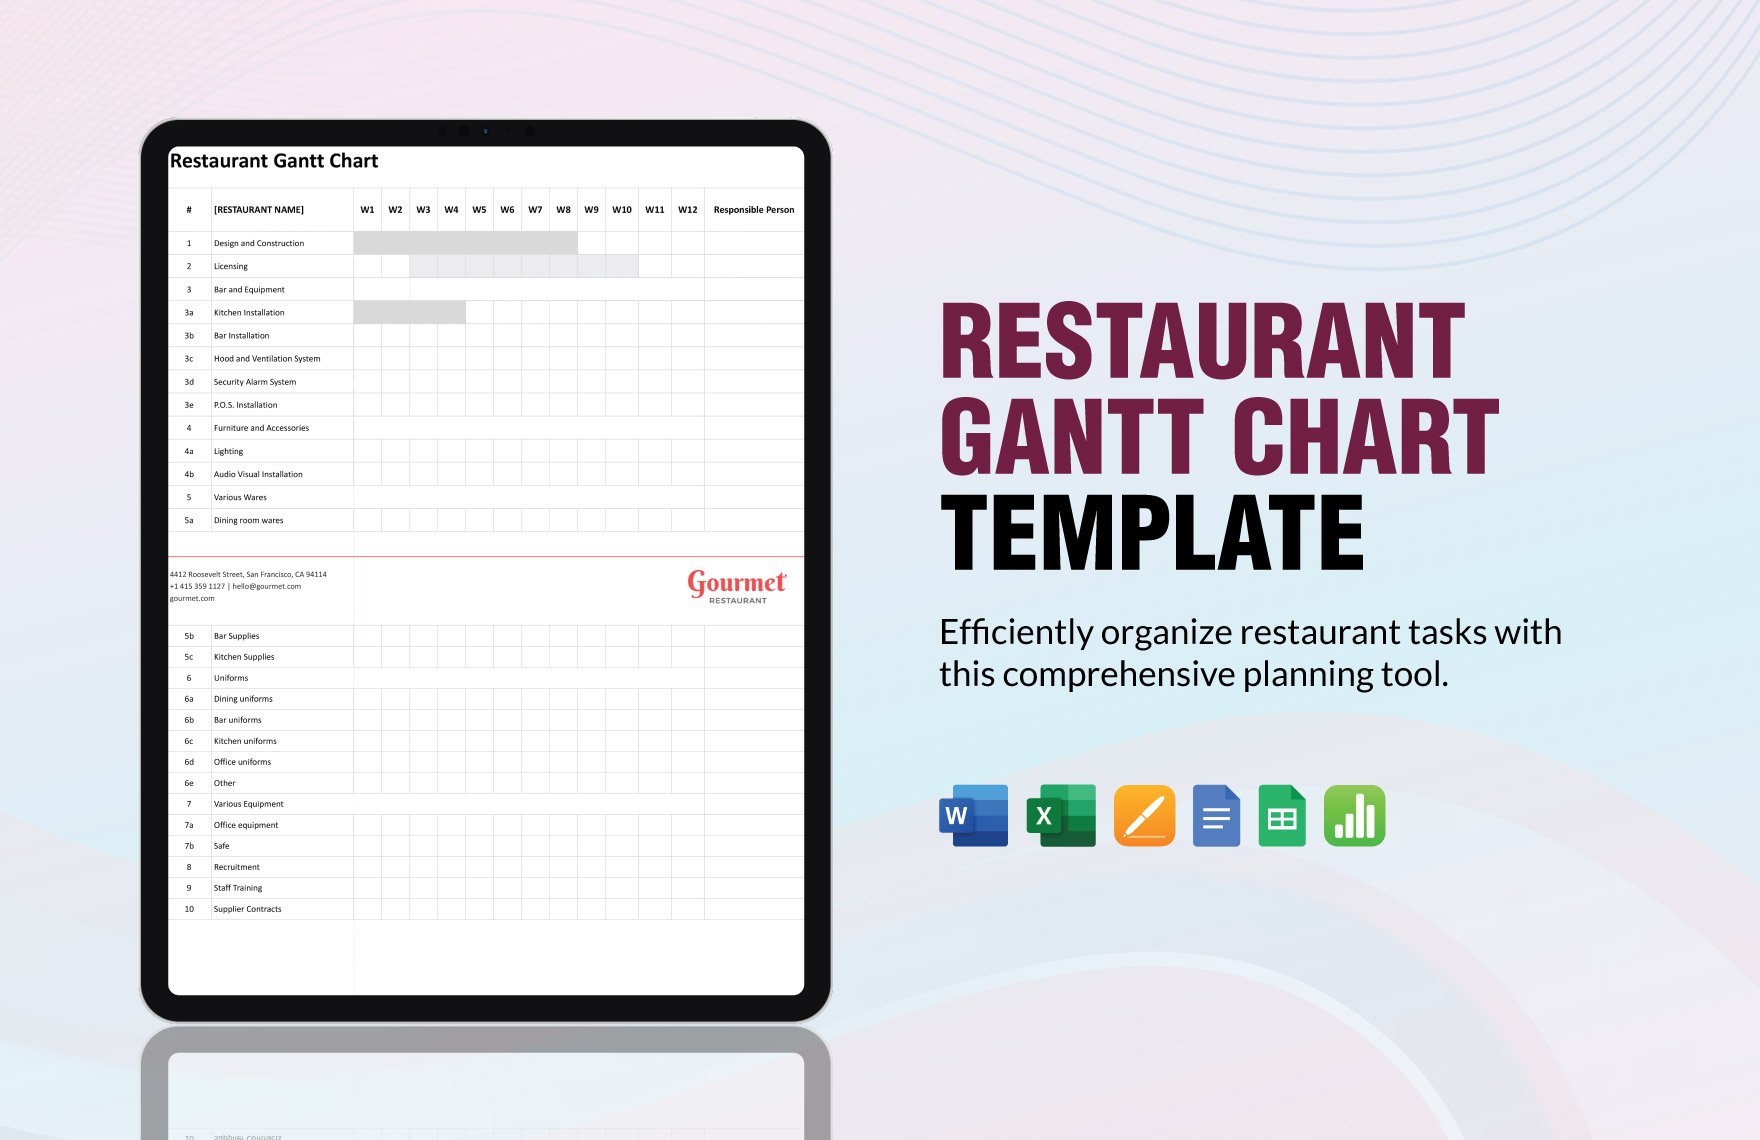
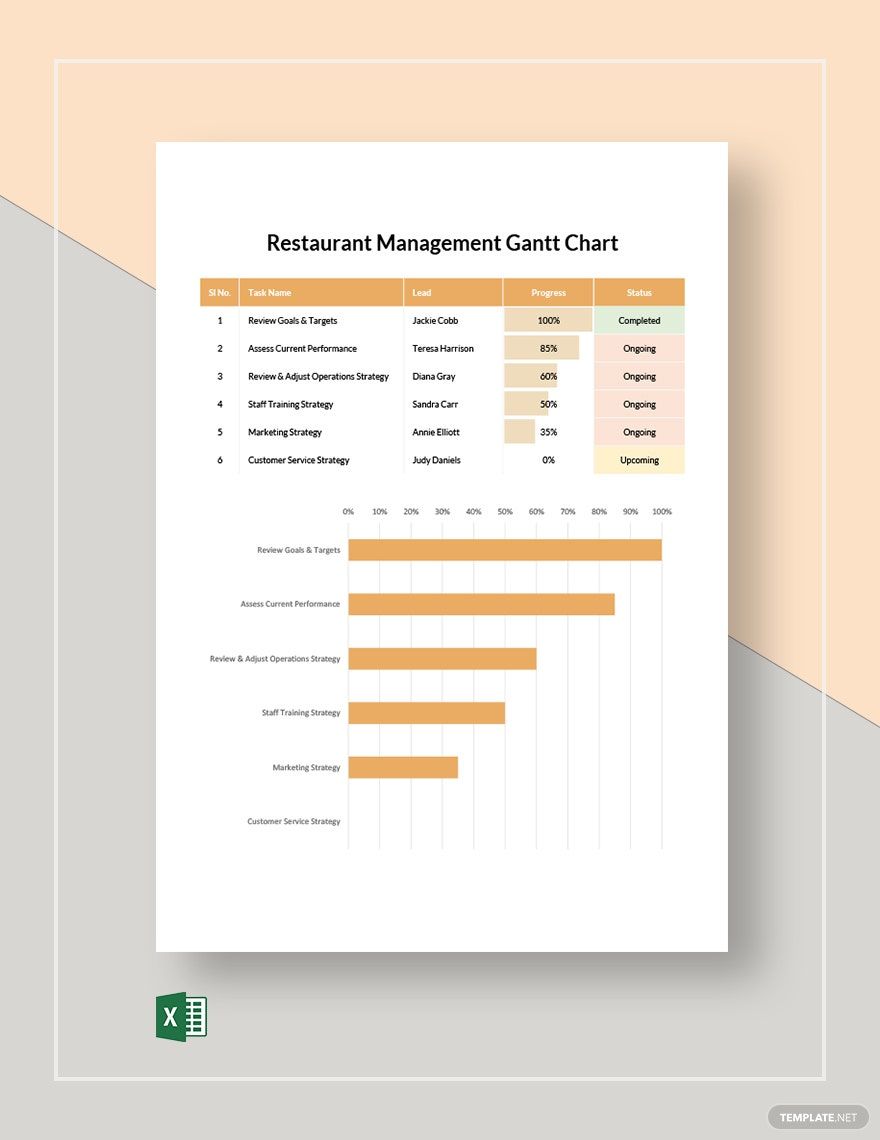
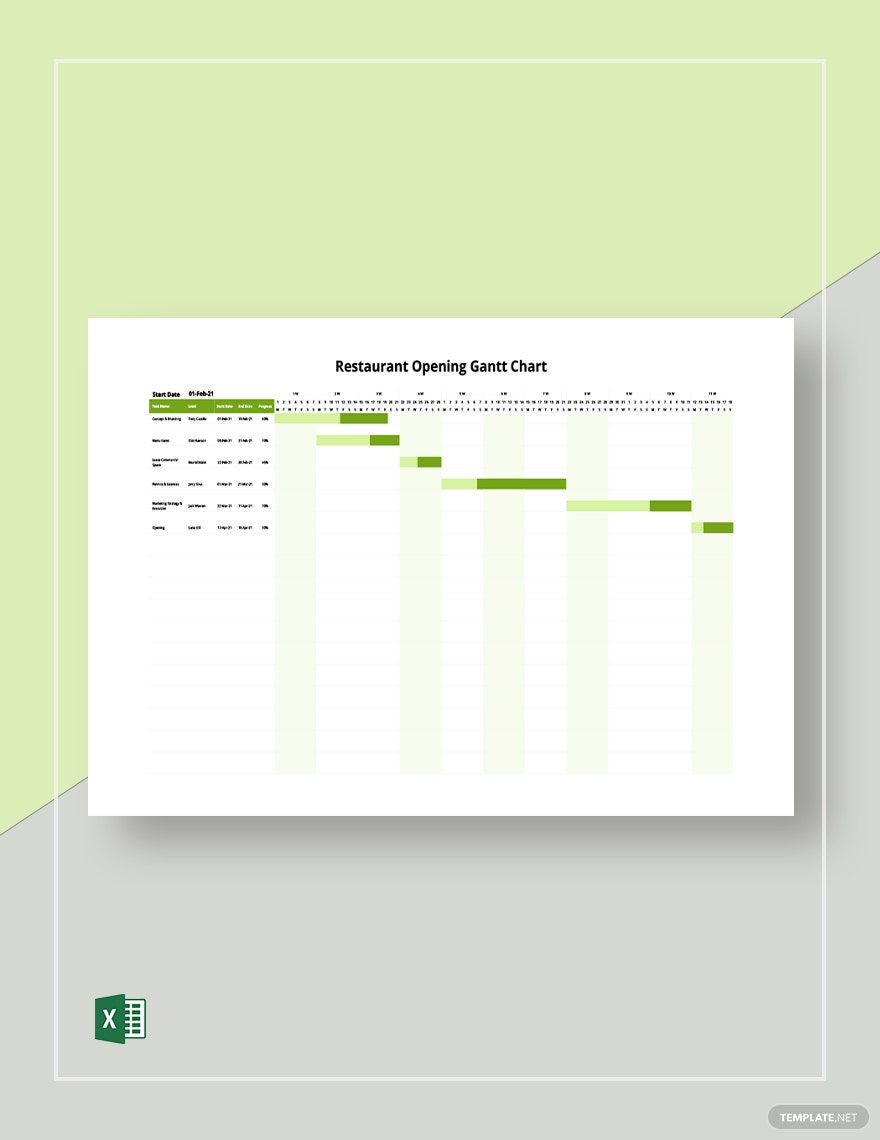
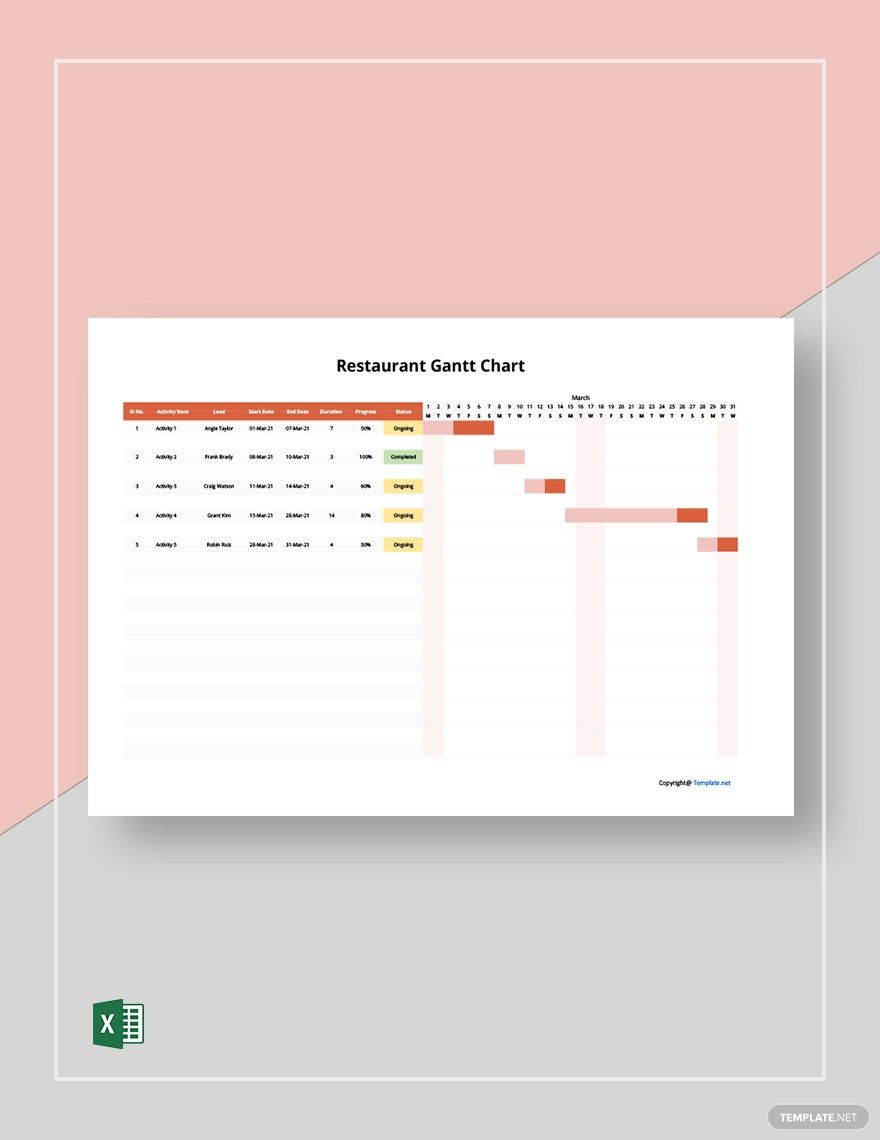
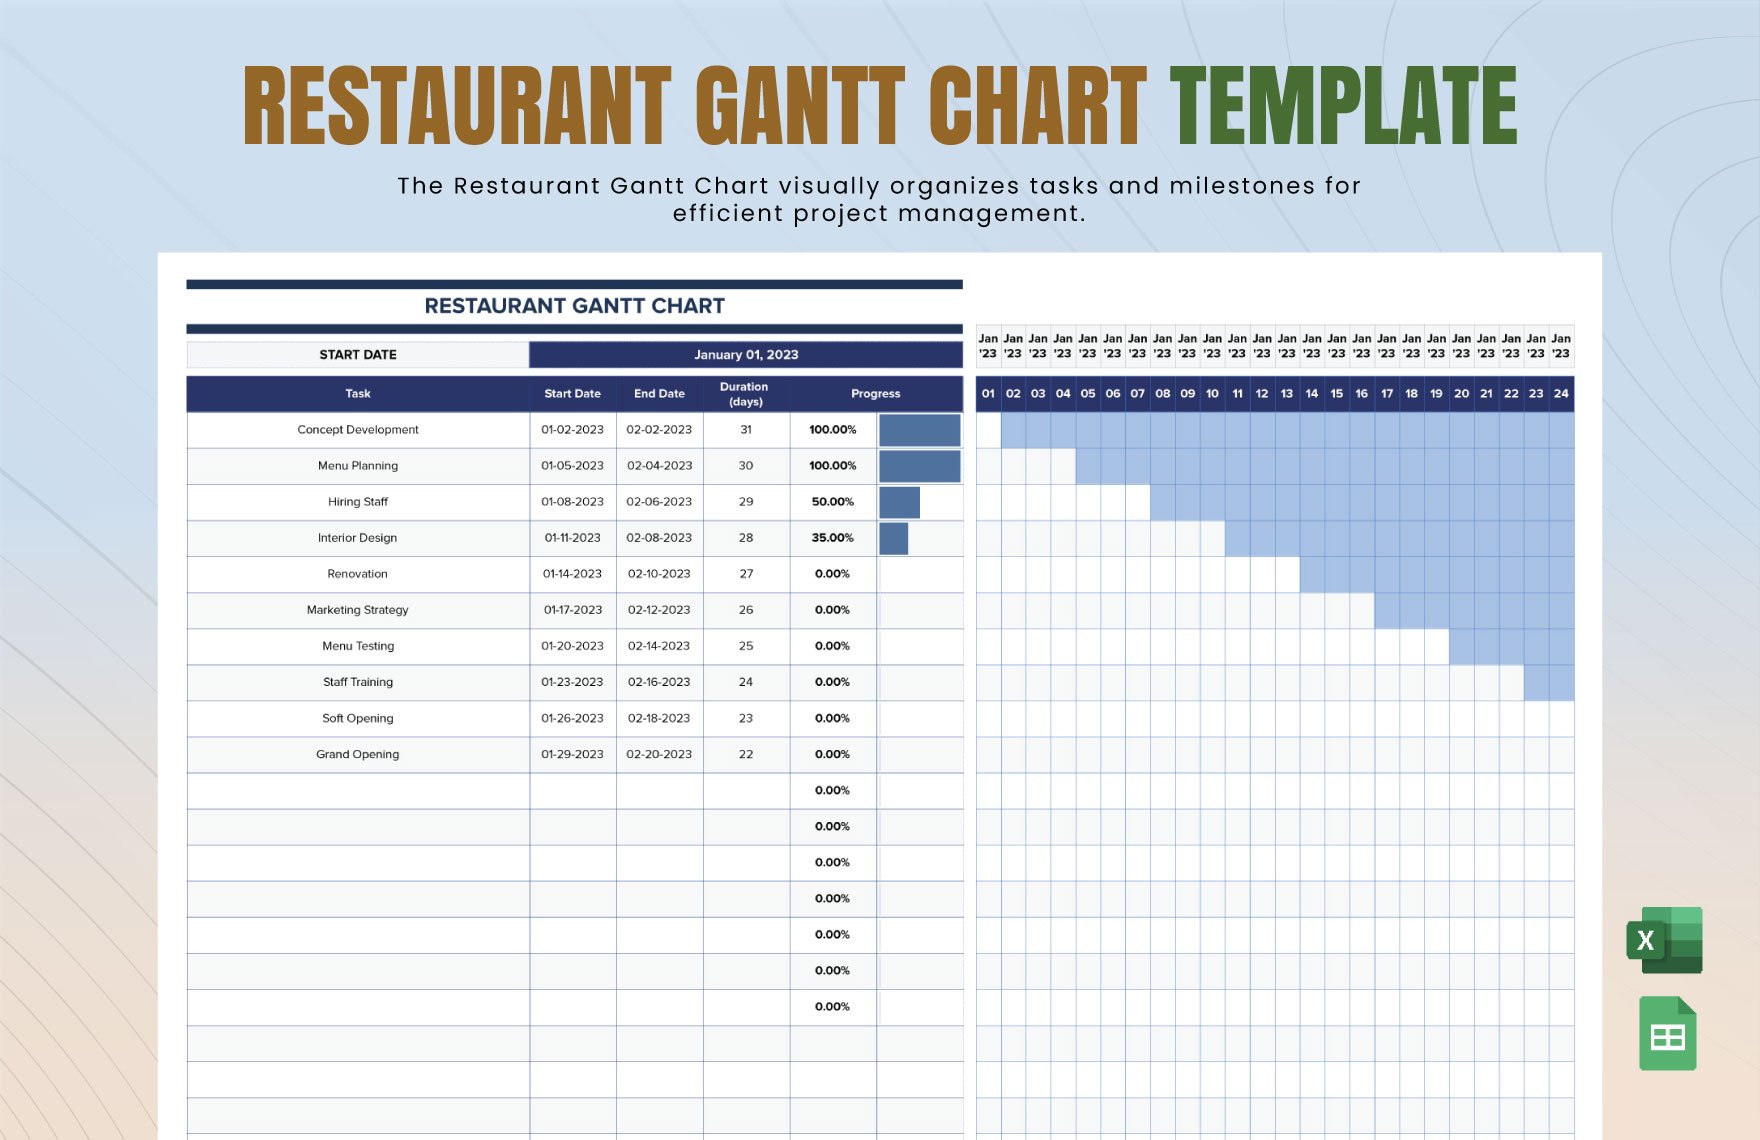
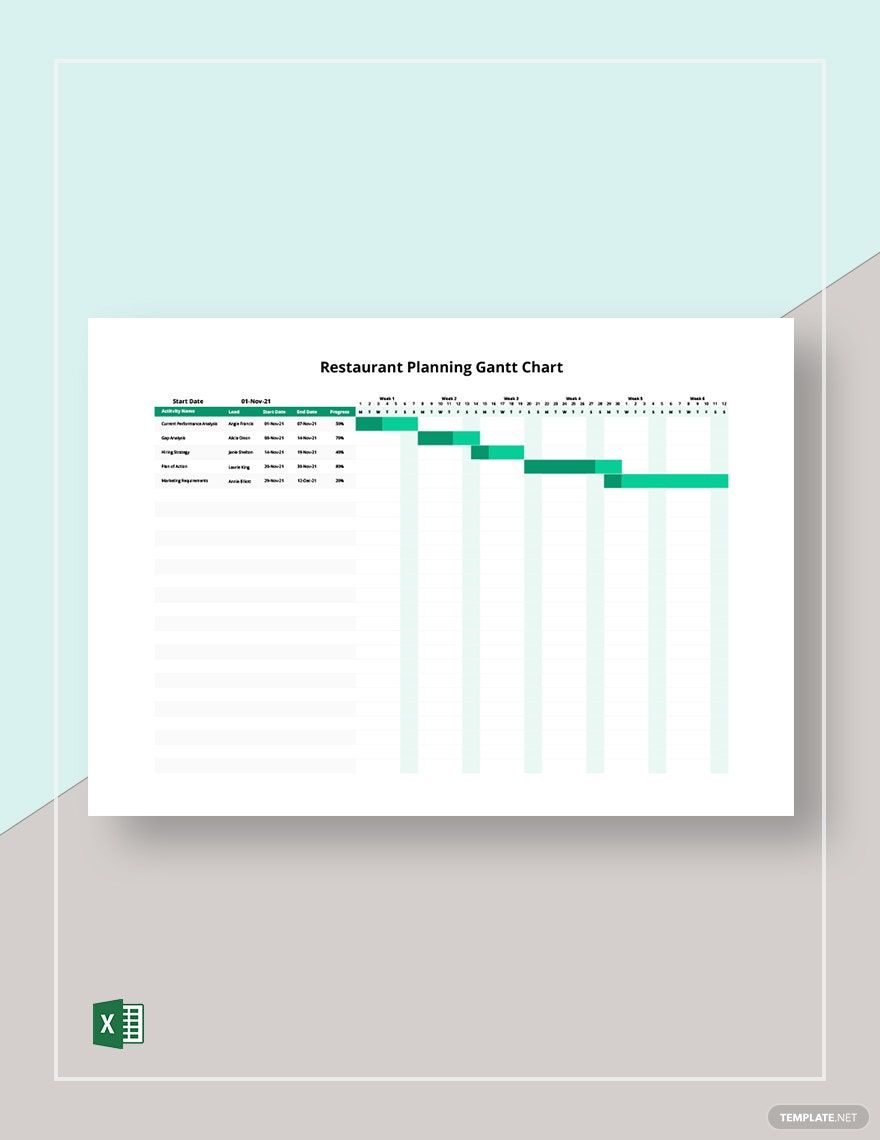
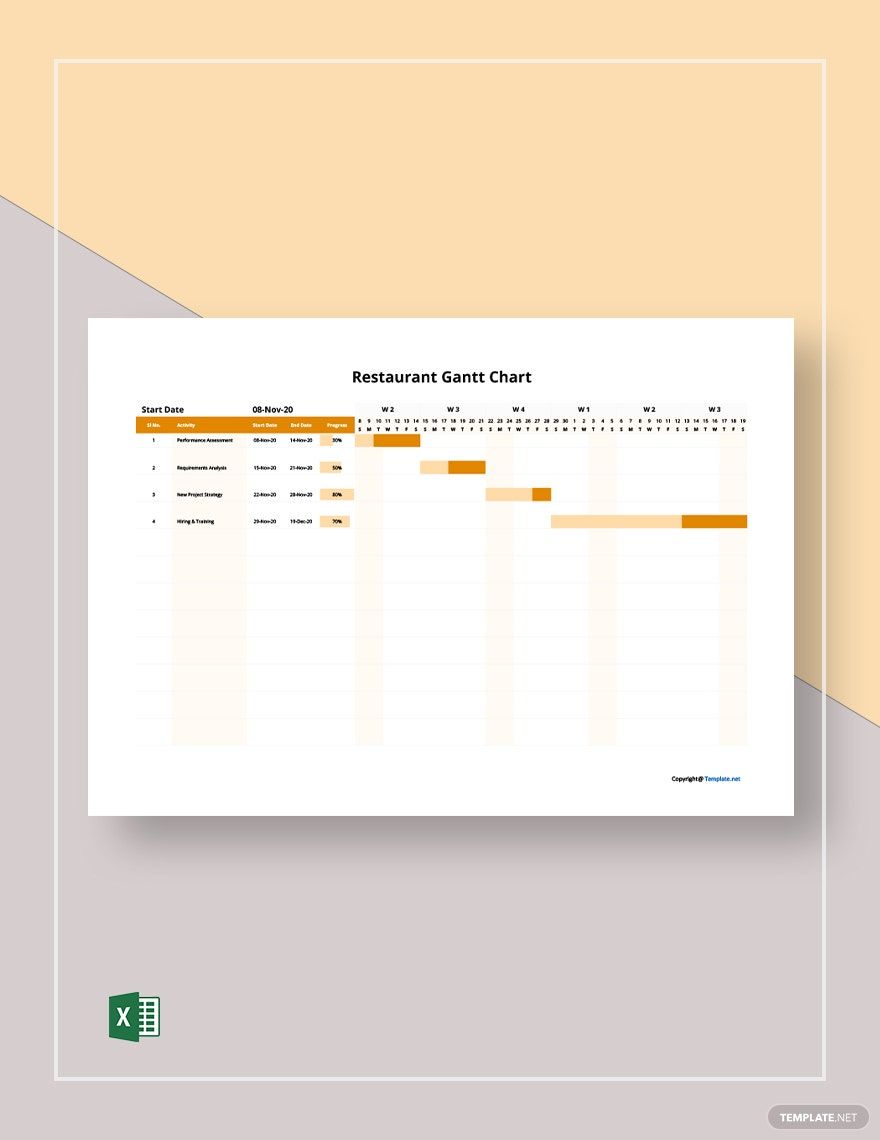
Whether you run a fancy cafe or a mom-and-pop diner, success in the food business requires effective and diligent work output. Thus, it’s advisable to incorporate the use of a Gantt chart that helps in overseeing the timeline of responsibilities for your waiters, cooks, etc. Use our professional well-made diagram, consider downloading one of our Restaurant Gantt Chart Templates! With the help of our easily editable samples, you can quickly prepare a chart for your culinary establishment. You are getting an entire range of unique samples here that already contain all the relevant content and artworks. Subscribe, download, edit, and print one now!
How to Make a Restaurant Gantt Chart?
From daily operational plans to monthly preventive maintenance, it’s hard to underestimate how much a Gantt chart can help with the inner workings of a restaurant business. After all, as explained by Investopedia, a Gantt chart’s bar-type visuals allow for efficient time management of tasks and responsibilities.
Not sure how to start with your restaurant Gantt chart? No problem—we’ve written a few easy-to-follow steps (below) to equip you with the best techniques!
1. Your Data Table
First, start with the data table. Open a new document in your preferred processing application and insert a grid table—programs that support this feature are those like MS Excel, Google Sheets, and so on. You should add 3 columns in the table, while the number of rows is dictated by how many tasks you need to input. However, you’ll also need to add an extra top row for labeling later.
2. Your Bar Chart
Next, insert another table into your document for the bar chart; position it either beside or underneath the previous one. Your bar chart’s number of rows is determined by how many tasks there are, like with your data table. Meanwhile, the number of columns should mirror the time available for fulfilling all of the tasks; for example, if you have 14 days, then give your bar chart 14 columns. You should also include 1 extra row and column for this table.
3. The Restaurant Gantt Chart’s Data
With the skeleton of your Gantt chart now laid down, it’s time to write down the information you’ll need for measuring your timelines. Begin by labeling the categories for both tables. In the data table, label each column as Tasks, Starting Day, and Expected Duration. Tasks are where you list down the names for tasks/activities, Starting Day shows which day in the available time frame a task begins, and Expected Duration shows the assumed number of days it takes to complete a task.
In the bar chart, the left-most column should label each row with a task. In the top row, label the columns to reflect the day number within the available time frame for accomplishing all tasks.
4. Measuring Your Timelines
Now that you have everything set up in your chart, you can now use it for simple measurement of task timelines. Pick your color of choice, then take values under Starting Day and use it to determine which day within the bar chart to color in first for each task. As days go by, fill in each succeeding cell as needed, gradually building up bar shapes in these rows.
If you’d like to download editable Gantt charts for catering duties, kitchen cleanup, and more, then be sure to check out our Restaurant Gantt Chart Templates!


