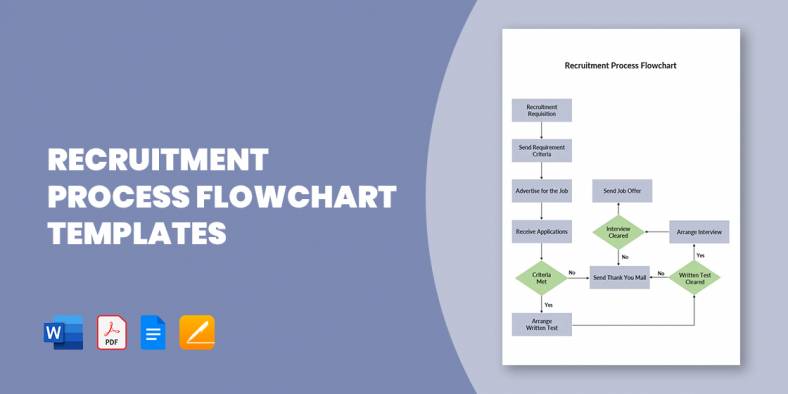
15+ Recruitment Process Flowchart Templates in PDF | MS Word
A flowchart of the recruitment and selection process, also known as recruitment workflow, is a design that outlines out the…
Jan 29, 2020


May 08, 2020
A waterfall chart represents data visualization of cumulative effect on initial value from sequential introduction of intermediate negative or positive values. This business chart is also known as Mario chart or flying bricks chart given its apparent suspension of bricks or columns in mid-air. It’s known as bridge in the finance sector. The initial & final value are presented as whole columns while floating columns interpret intermediate values. You may also like Table Seating Chart Templates


sixteenseven.com | This waterfall chart is a simple waterfall chart, which explains the cumulative effect of all the steps at the final result. It shows the amount of resources required at each step and the total at the final result column.

lloyds.com | The solvency waterfall chart creates a waterfall chart to check the solvency of an enterprise. Different colors are used to indicate the different stages to find out the solvency of the enterprise.

A Custom Waterfall Chart is used to create customizable waterfall charts. It can used to indicate the progress of a project, revenues generated per quarter or revenue generated per branch of the company, etc.

nasa.gov | The Risk waterfall chart indicated the risk factor associated with every new project a company undertakes. The companies create the risk waterfall chart for all the projects and continue with the project with the lowest risk.

lexjansen.com | A free easy waterfall chart can easily denote positive and negative values in the chart. It is used to check the revenue generated by the company at each quarter of the year.

extremepresentation.typepad.com | This stacked waterfall chart comes up with a series of charts interconnected to each other. The main chart focuses on 4 most important attributes such as Comparison, Relationship, Distribution & Composition.

The sample waterfall chart is a simple waterfall chart which shows positive and negative values throughout the months and the initial and final values. It shows the market trend of a particular item and the sell for each month.
If you need assistance in creating waterfall charts, a waterfall chart template Excel would be helpful for you with its pre-defined framework. It comes with readymade columns and you would just need to input your specific data on the Chart Templates.

A flowchart of the recruitment and selection process, also known as recruitment workflow, is a design that outlines out the…
Logistics management is a tough job, as you are to handle a vast network of processes. Plus, the system incorporates…

All businesses require great management, so all operations run smoothly and easily, and management applies to logistics as well. Maybe…
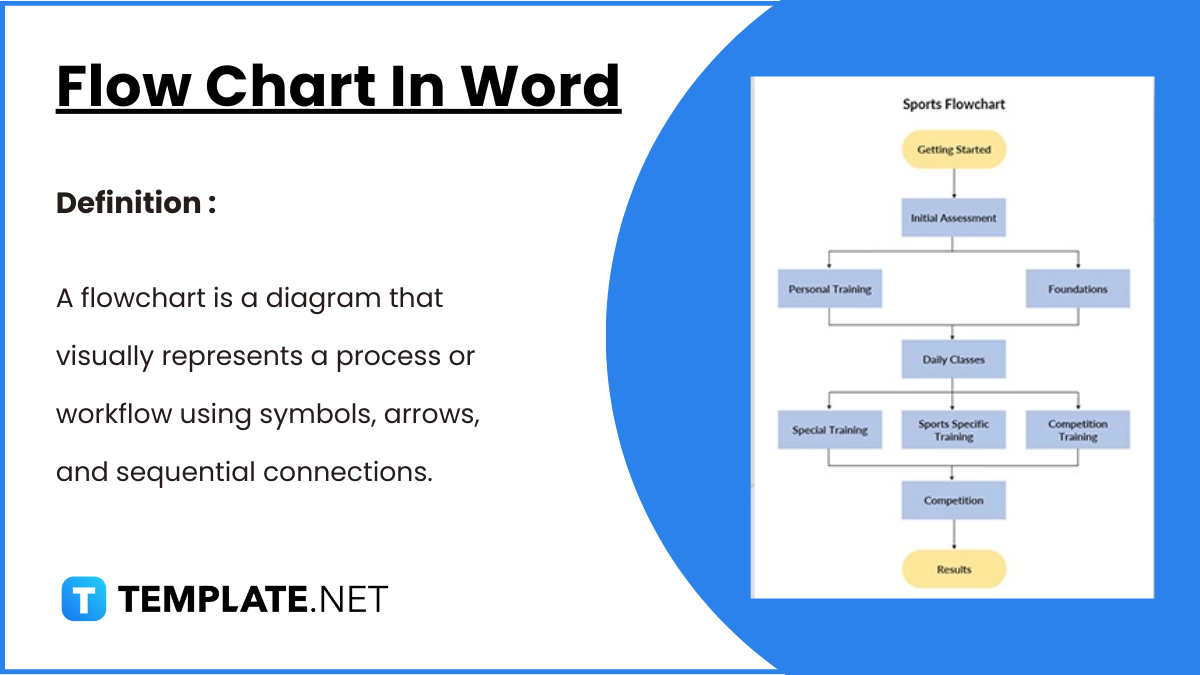
Flowcharts in Word offer a convenient way to visually represent processes, workflows, and systems. With easy-to-use shapes and connectors, Word…
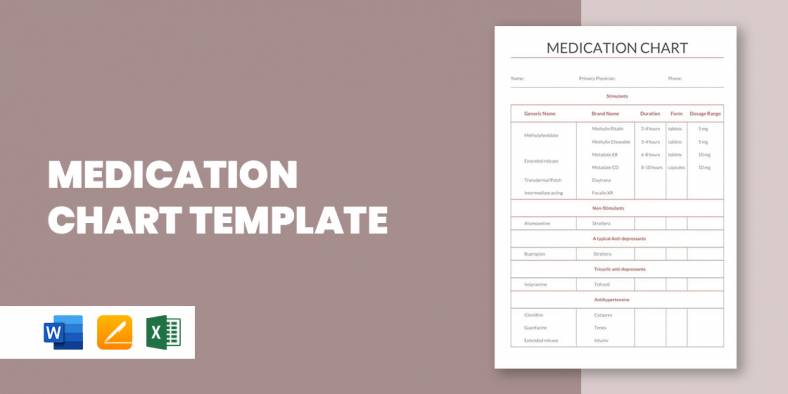
A medication chart template is really handy when you have to keep track of the number of medications prescribed for…

If you have ever had to prepare a flow chart, you’d thoroughly understand that it could be a back breaking…
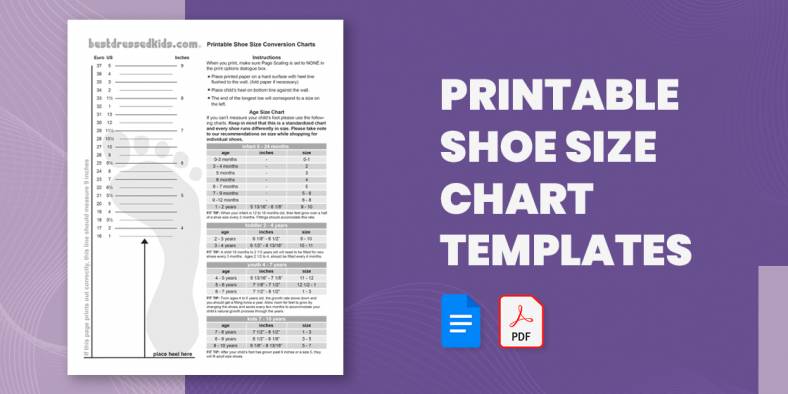
Going shoe shopping soon? Here is a Chart Template to help you avoid the annoyance and embarrassment of getting the…

If you plan to show the basics of guitar playing or just want to show how to play a song…

One of the important parameters of the body that needs to constantly be checked and measured is the blood pressure.…