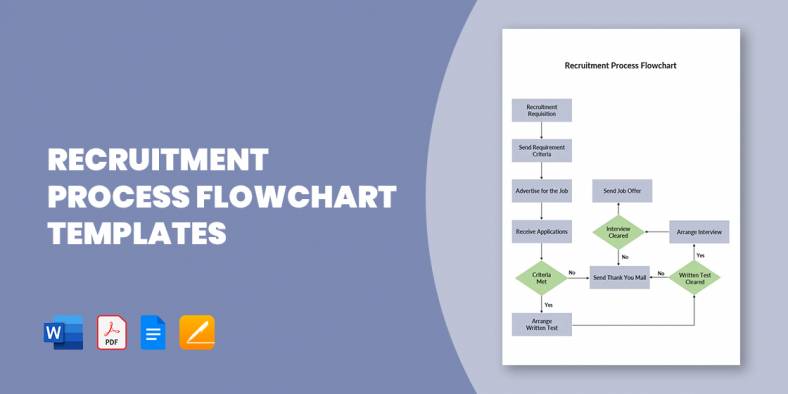
15+ Recruitment Process Flowchart Templates in PDF | MS Word
A flowchart of the recruitment and selection process, also known as recruitment workflow, is a design that outlines out the…
Jan 29, 2020


Mar 29, 2024
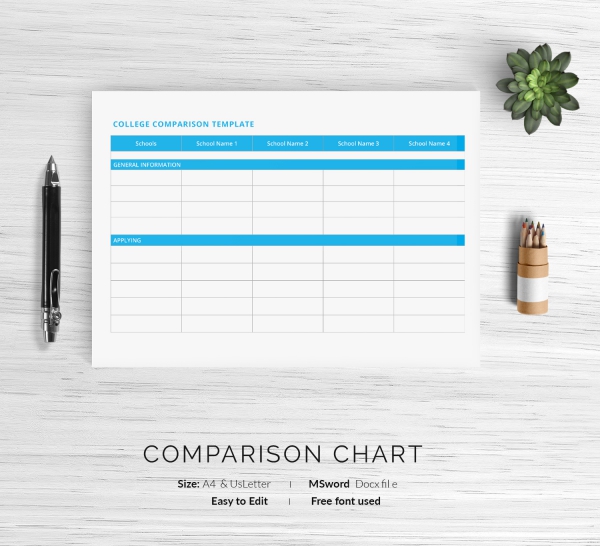
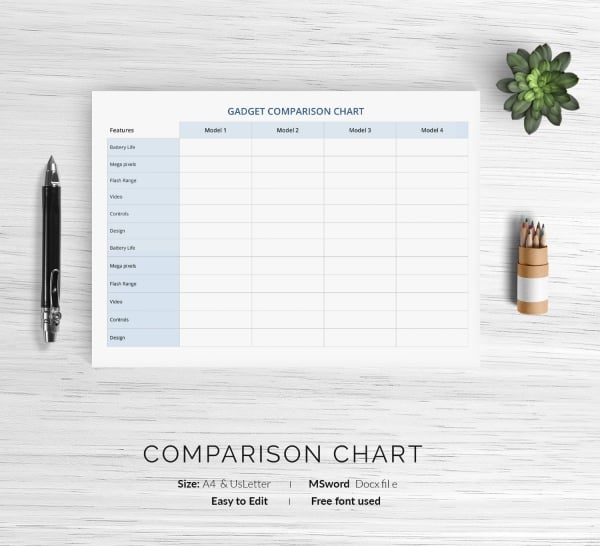
More often than not, comparisons between two things can arise in companies and organizations. The best way to compare and contrast a certain number of parameters would be to make a chart and list out all things that are common and the differences between these parameters that are to be compared. A sample comparison charts is used for that same purpose – as an easy and efficient way to compare two parameters or two ideas or just about any number of ideas. You can implement comparison matrix charts for stock costs, body heights, Apple Watch features, iPhone sizes, health supplements, COVID vaccines, job benefits, and much more.

A comparison chart template is designed based on the project’s necessity. Before you free download one of the chart templates that we have got, you should know what a label such as that is usually made up of. Here are all the components of a comparison chart template listed out.


www.insight.com
masslibsystem.org

webcache.googleusercontent.com
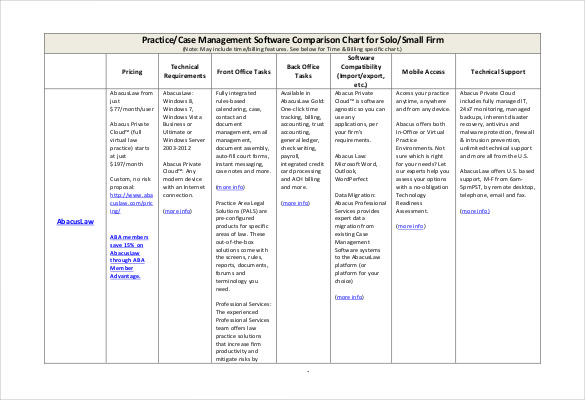
www.americanbar.org
104.238.182.218

www.aallnet.org
www.dol.gov
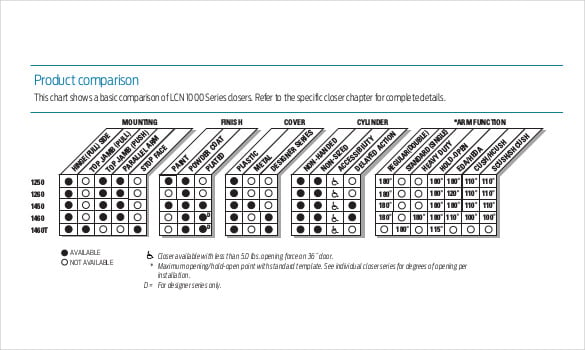
us.allegion.com
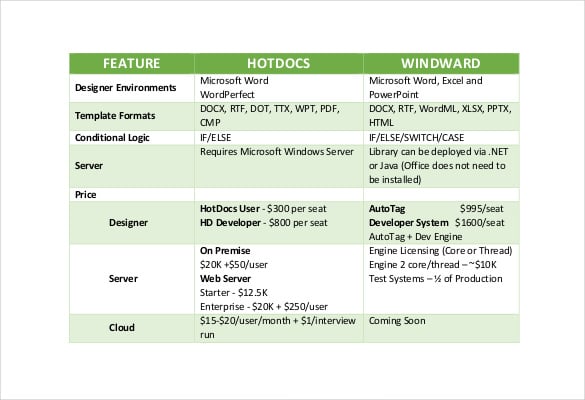
windward.net
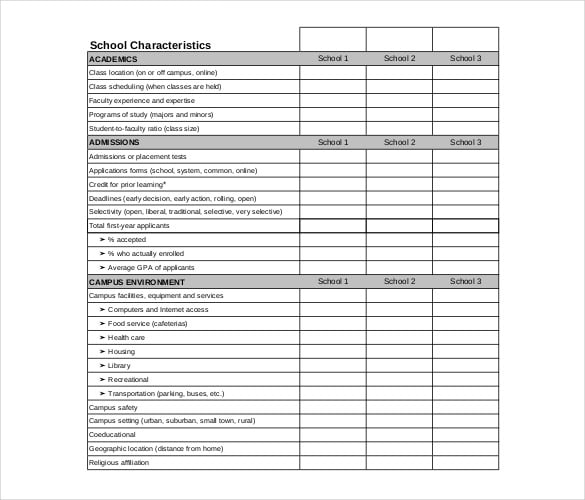
ohe.state.mn.us
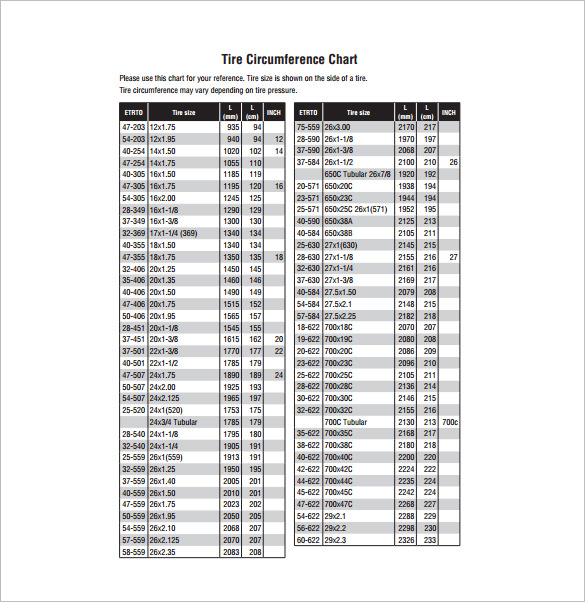
cateye.com | This tire size comparison chart provides details of tires of every dimension. The simple chart works as a perfect reference for people who need this information, especially people working in the automobile industry.
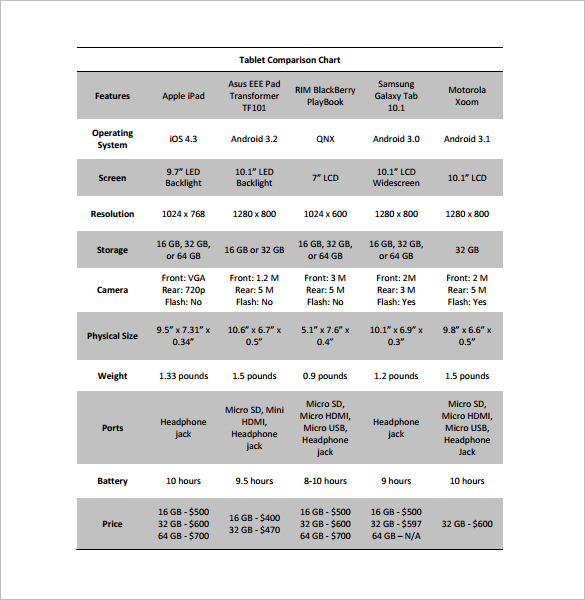
cedarville.edu | The tablet comparison chart provides an in-depth insight into some of the best tablets out in the market. It compares the tablets on the ground of OS, screen size, resolution, price, etc. You can also see more on Comparison Charts in Google Docs.
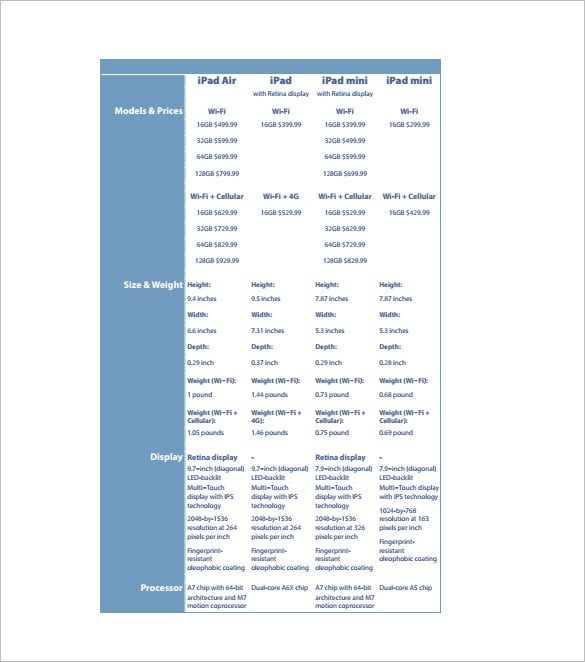
wordpress.com | The iPad comparison chart is suitable for people who want to buy an iPad but don’t know which model will be preferable. The chart compares the different iPad models on the ground of price, weight, display, etc. You may also like Comparison Chart in Google Docs Templates.
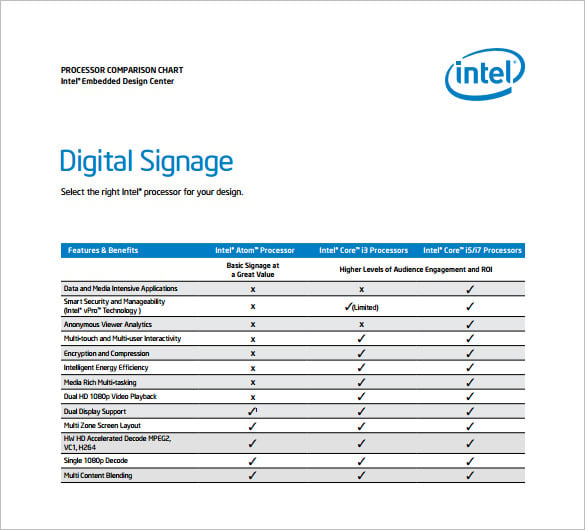
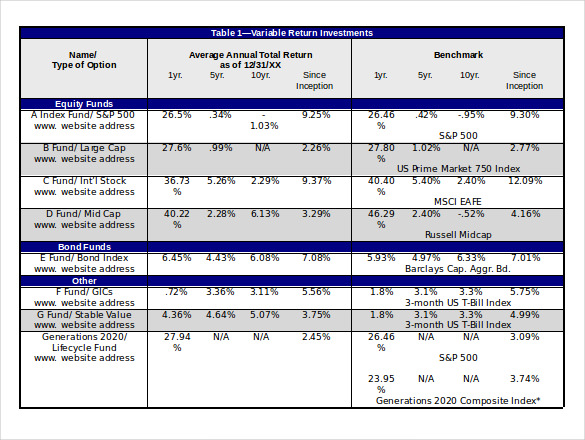
intel.ru | The Intel processor comparison chart is for all the computer geeks out there. This basic chart provides insight into three processors, the technical specification of each, and the differences between them. You can also see more on Comparison Chart in Excel.

kingston.com | The video comparison chart compares SDHC cards and other similar products in the market to find the best one. It compares on the grounds of size, speed, price, etc.
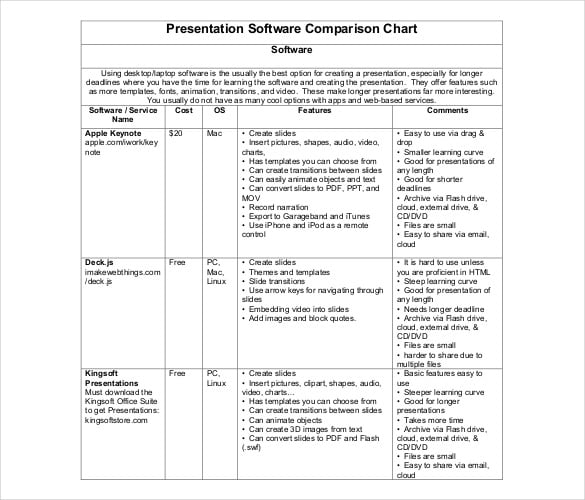
free-power-point-templates.com
free-power-point-templates.com

career-connection.mntc.edu
mashable.com
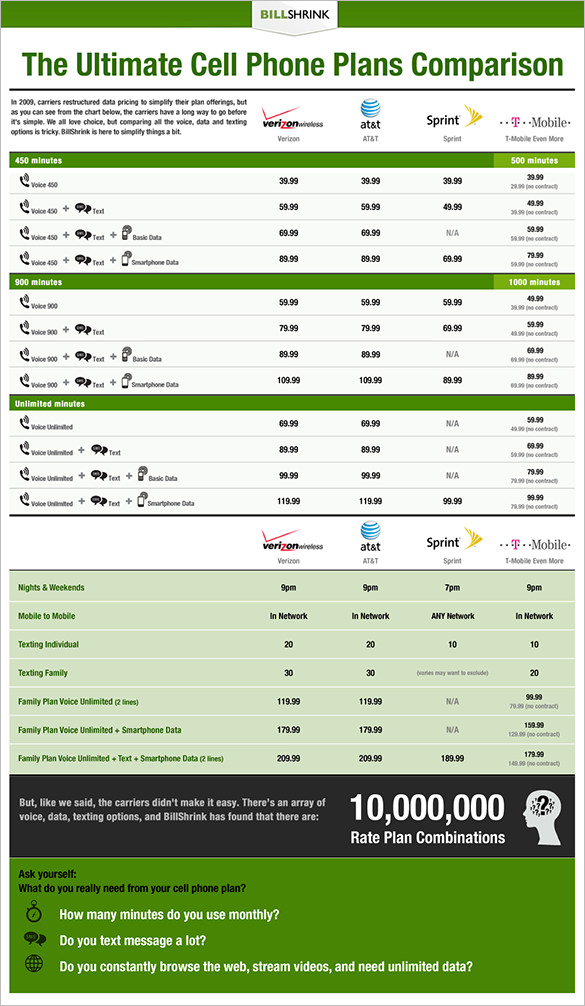
The cell phone comparison chart compares the plans provided by the companies and the fees they are asking for. A great way to check for cheap alternatives for calling, text, and internet. You can also see more on editable charts.
sendgrid.com
 college.acaai.org
 meseec.ce.rit.edu
 cpg.org
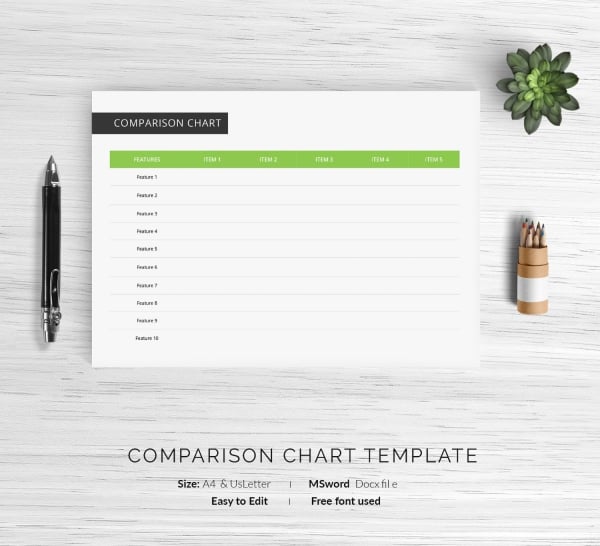
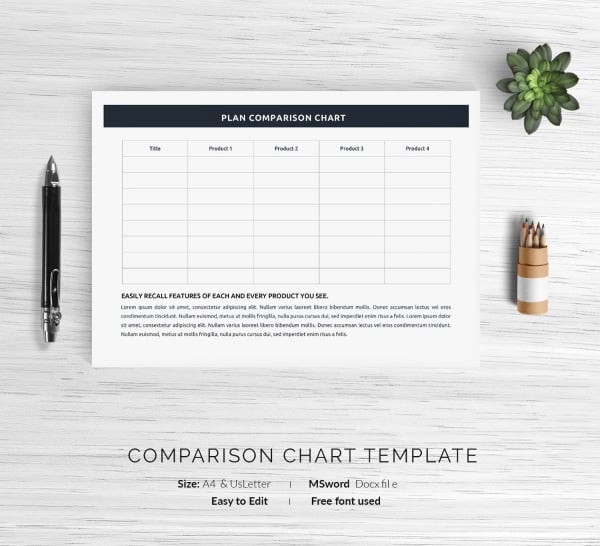
A comparison chart, also known as a comparison diagram, is a diagram wherein a comparison is made between two or more objects, events, processes, or groups of data. It offers qualitative and/or quantitative information.
The following are the most commonly used comparison charts:
If you want to compare things between different groups or to track changes over time, it is best to use a bar chart. Similarly, if you want to track changes over short and long periods, you can make use of a line graph.
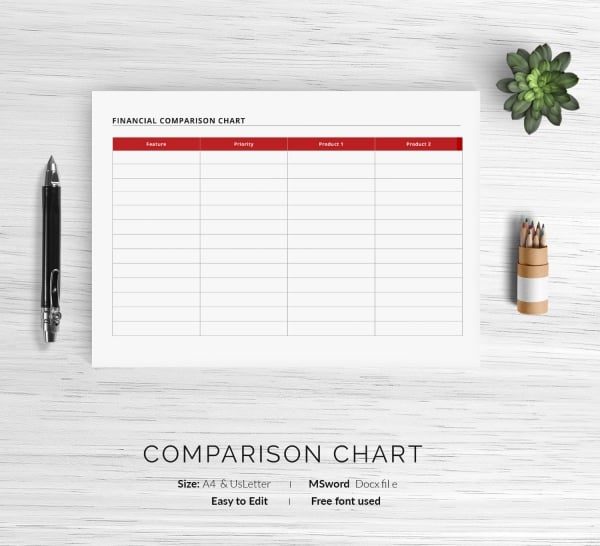
Comparison printable charts have many advantages. Here are some:
Comparison Charts in PDF are widely used in various fields. They are mainly used in academic studies, research studies, and survey findings. They help summarize the data in the most visually effective manner.

A flowchart of the recruitment and selection process, also known as recruitment workflow, is a design that outlines out the…
Logistics management is a tough job, as you are to handle a vast network of processes. Plus, the system incorporates…

All businesses require great management, so all operations run smoothly and easily, and management applies to logistics as well. Maybe…
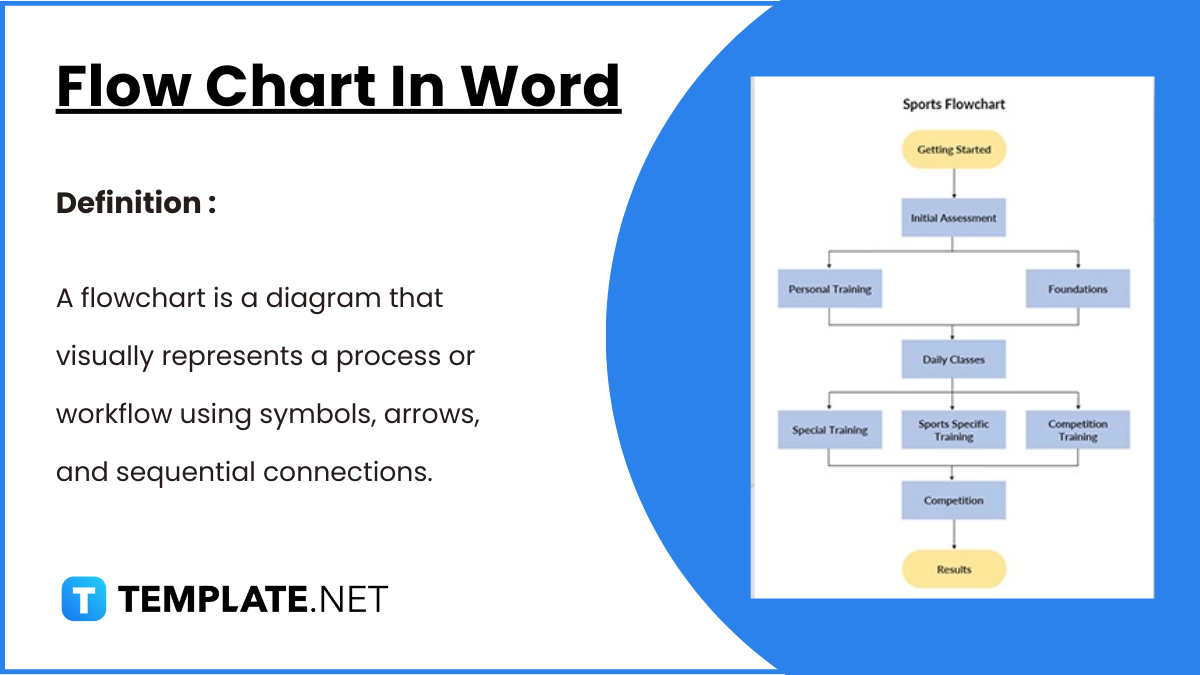
Flowcharts in Word offer a convenient way to visually represent processes, workflows, and systems. With easy-to-use shapes and connectors, Word…
A medication chart template is really handy when you have to keep track of the number of medications prescribed for…
If you have ever had to prepare a flow chart, you’d thoroughly understand that it could be a back breaking…
Going shoe shopping soon? Here is a Chart Template to help you avoid the annoyance and embarrassment of getting the…
If you plan to show the basics of guitar playing or just want to show how to play a song…
One of the important parameters of the body that needs to constantly be checked and measured is the blood pressure.…