Free U.S. Household Energy Expenditures by Income Bracket (2020-2025) Chart
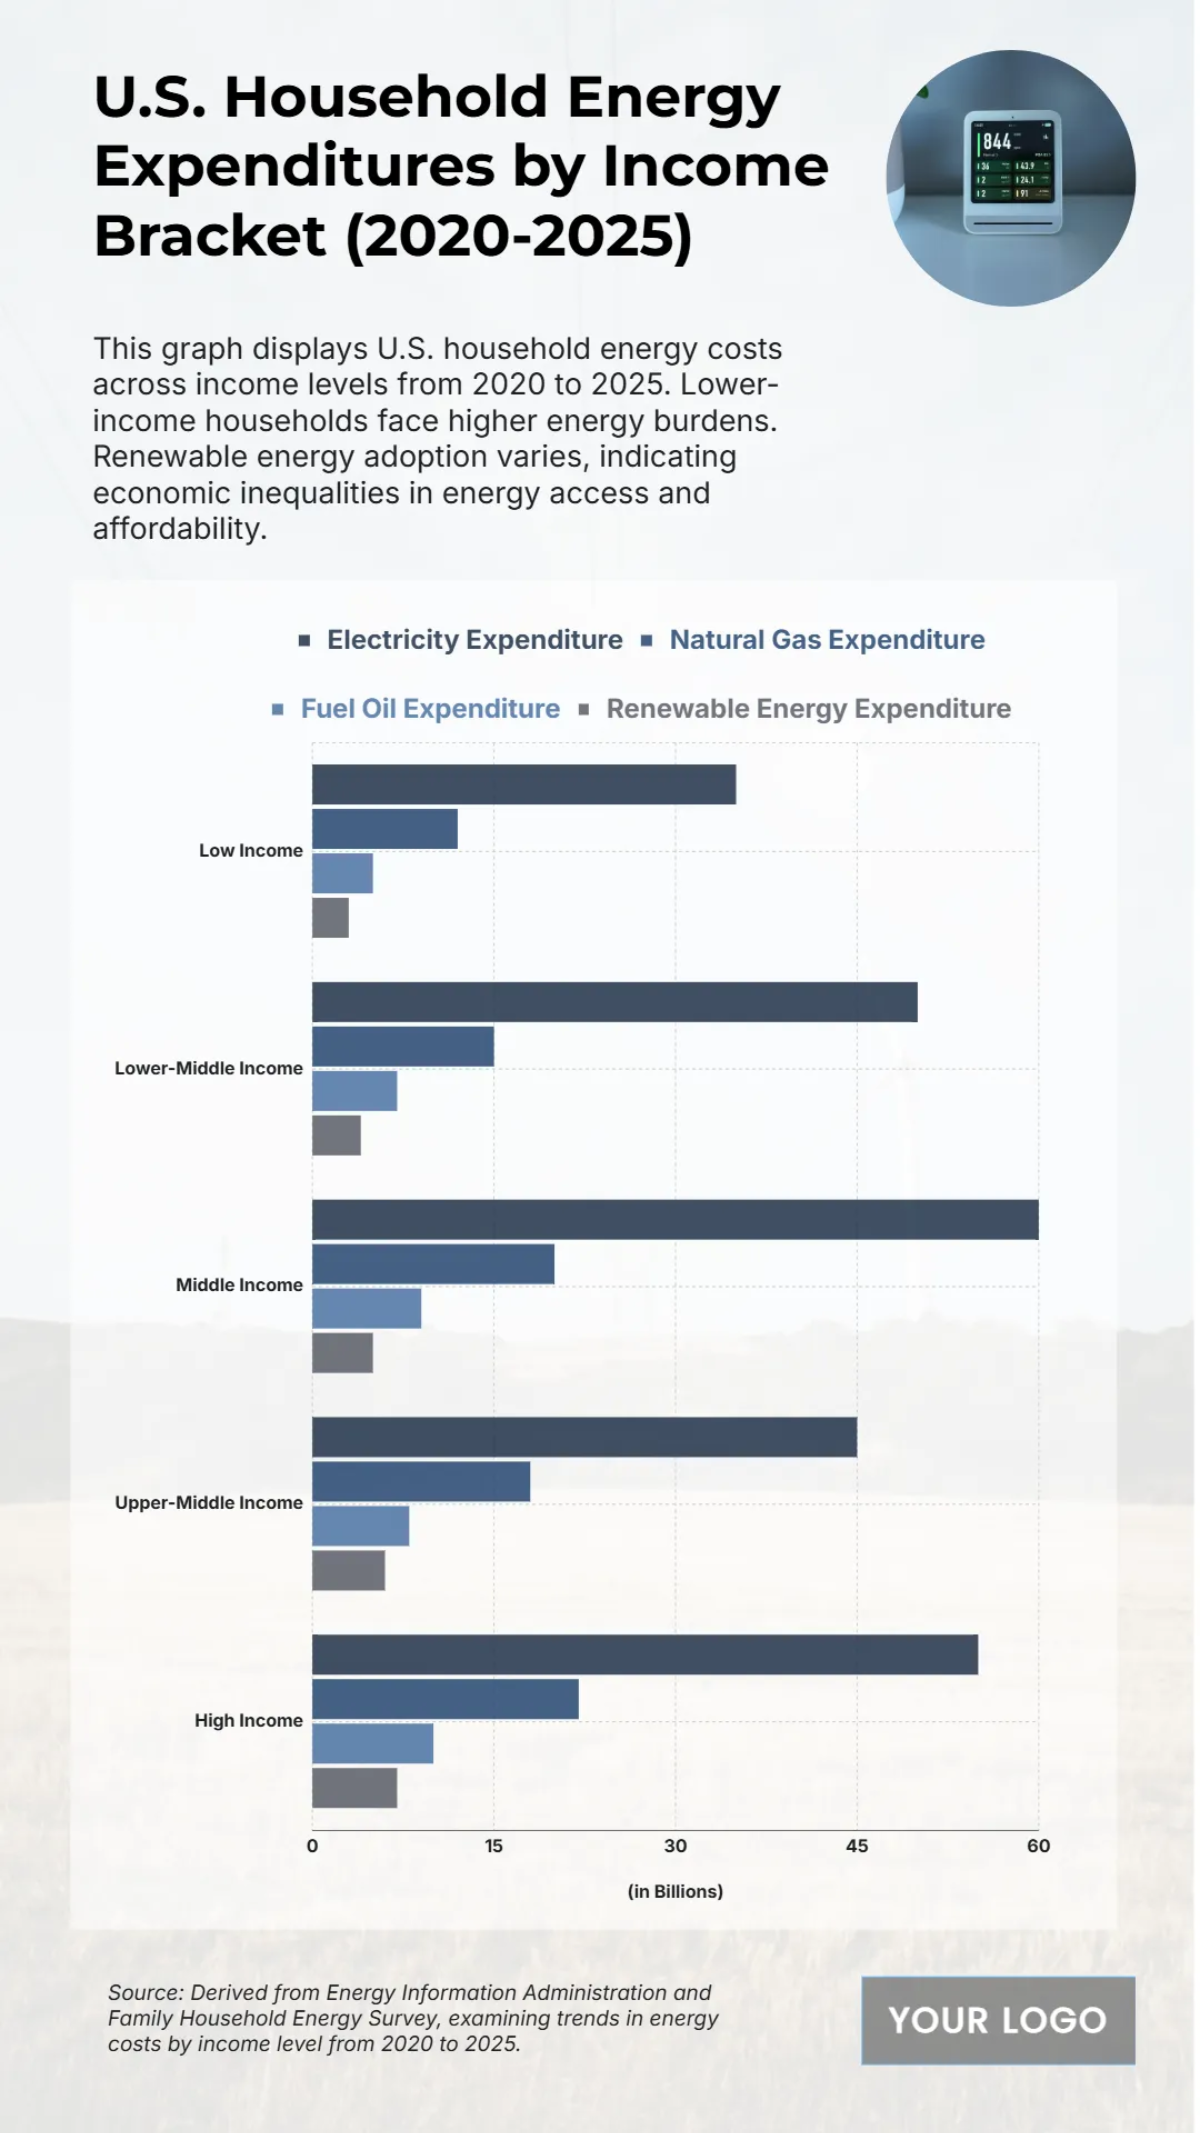
The chart provides an overview of US household energy spending by income from 2020 to 2025, revealing significant differences in spending patterns. Natural gas is the largest energy expenditure for all brackets except low income. High-income households spend the most on electricity, reaching around $30 billion, and have the highest renewable energy spending at $10 billion. The lower-middle and middle-income brackets spend the most on natural gas, with a peak of about $50 billion. The data also indicates that lower-income households face a disproportionately high energy burden, while their consumption of renewable energy remains the lowest.


