Free U.S. Top 20 States by Average Commuting Costs (2015-2025) Chart
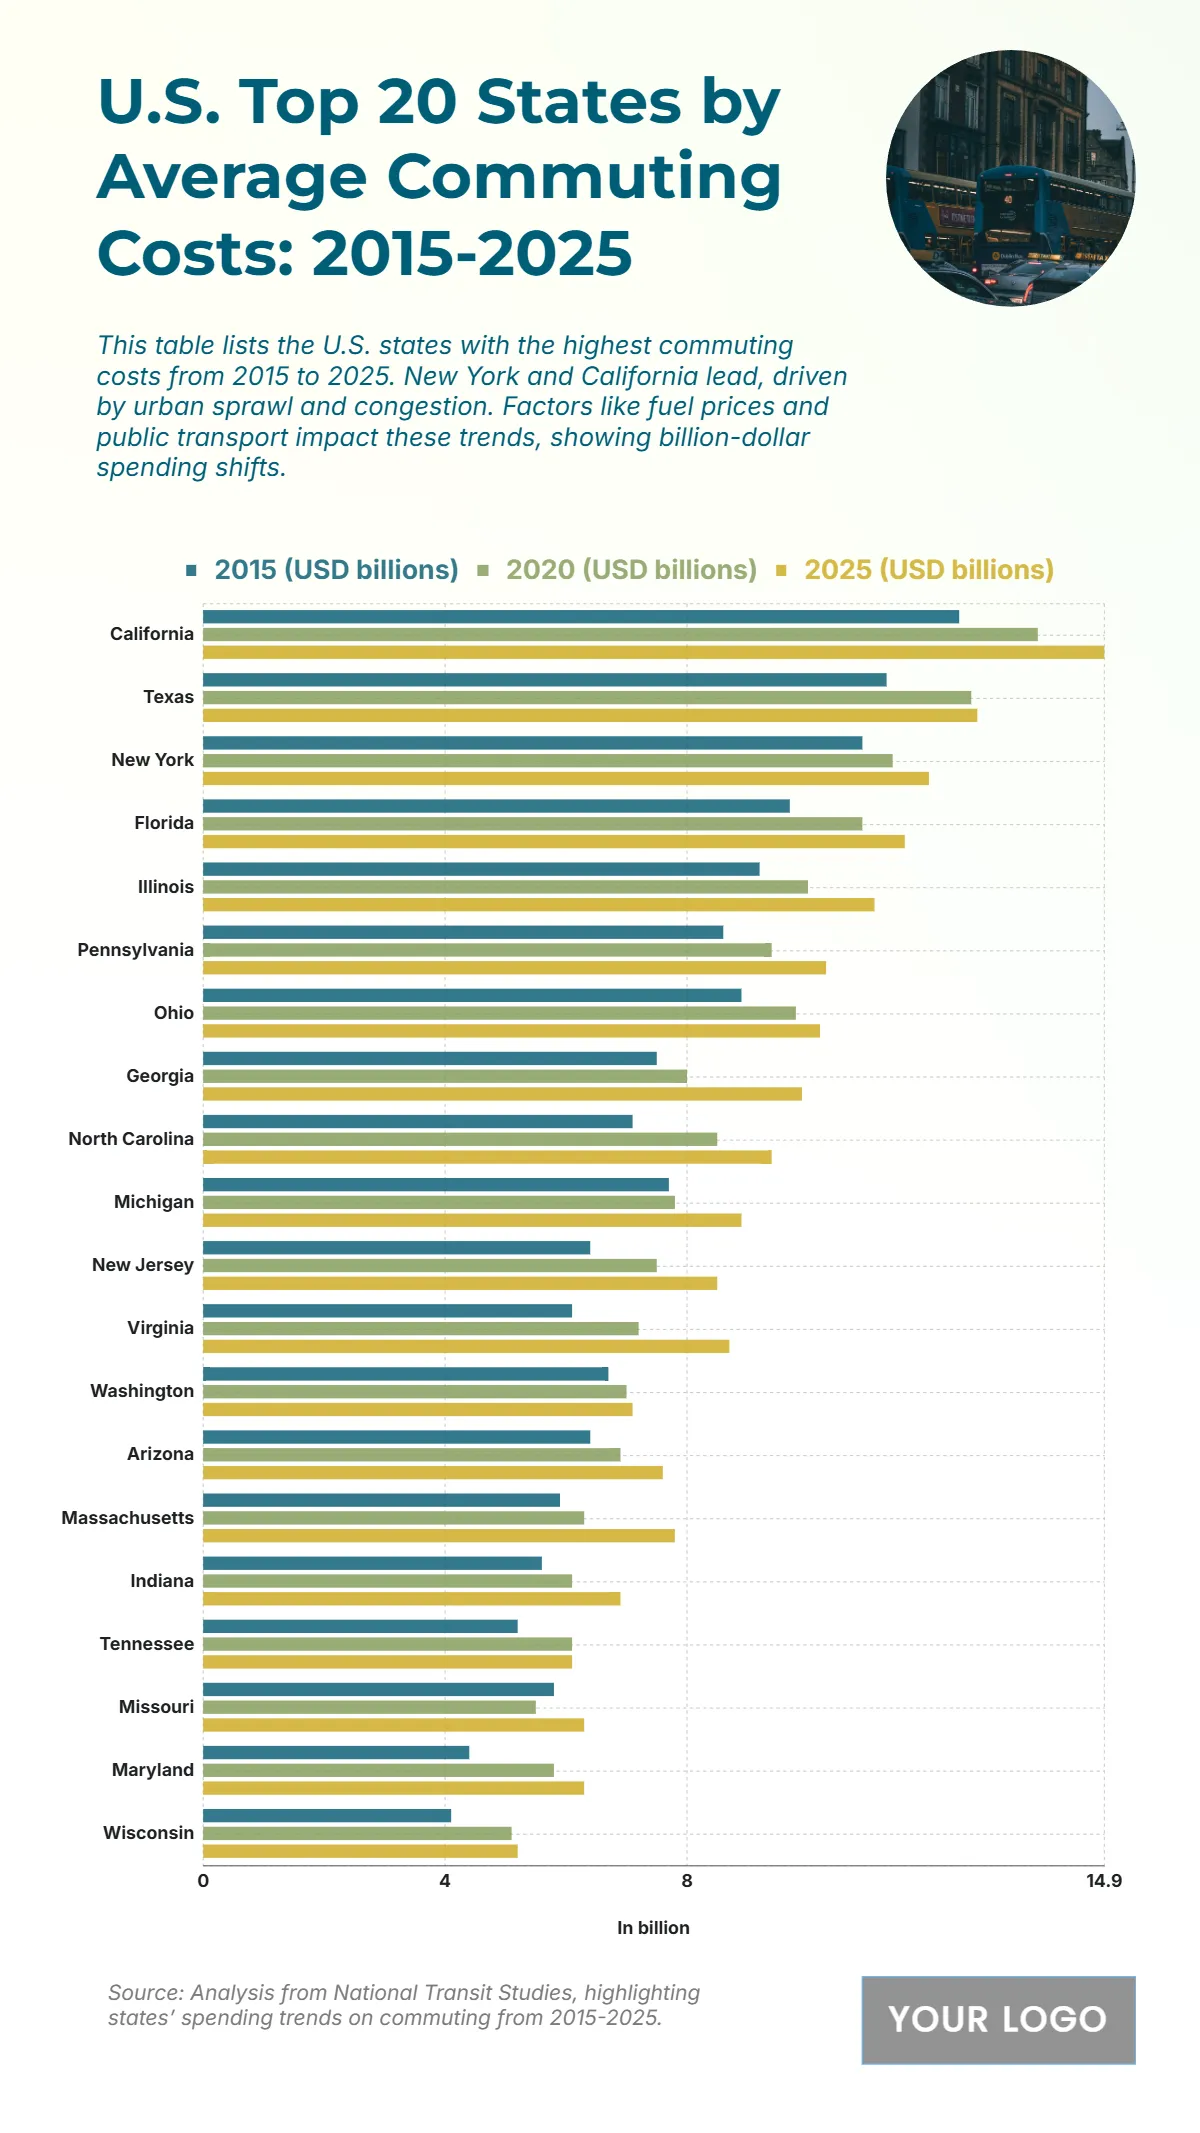
The chart shows a steady rise in average commuting costs across the top 20 U.S. states between 2015 and 2025, driven by urban congestion, fuel price increases, and transportation patterns. California leads the list, with commuting costs increasing from $12.5 billion in 2015 to $14.9 billion by 2025, followed closely by Texas, which grows from $11.3 billion to $12.8 billion. New York climbs from $10.9 billion to $12 billion, while Florida increases from $9.7 billion to $11.6 billion. Mid-range states such as Illinois, Pennsylvania, and Ohio also show notable growth, reaching $11.1, $10.3, and $10.2 billion respectively in 2025. Georgia and North Carolina reflect rising costs nearing $10 billion. Smaller but significant increases are observed in states like Massachusetts, Indiana, and Tennessee, each exceeding $6 billion. Even states with lower costs such as Maryland and Wisconsin show a clear upward trend, reflecting a nationwide pattern of commuting expense growth.
| Labels | 2015 (USD billions) | 2020 (USD billions) | 2025 (USD billions) |
|---|---|---|---|
| California | 12.5 | 13.8 | 14.9 |
| Texas | 11.3 | 12.7 | 12.8 |
| New York | 10.9 | 11.4 | 12 |
| Florida | 9.7 | 10.9 | 11.6 |
| Illinois | 9.2 | 10 | 11.1 |
| Pennsylvania | 8.6 | 9.4 | 10.3 |
| Ohio | 8.9 | 9.8 | 10.2 |
| Georgia | 7.5 | 8 | 9.9 |
| North Carolina | 7.1 | 8.5 | 9.4 |
| Michigan | 7.7 | 7.8 | 8.9 |
| New Jersey | 6.4 | 7.5 | 8.5 |
| Virginia | 6.1 | 7.2 | 8.7 |
| Washington | 6.7 | 7 | 7.1 |
| Arizona | 6.4 | 6.9 | 7.6 |
| Massachusetts | 5.9 | 6.3 | 7.8 |
| Indiana | 5.6 | 6.1 | 6.9 |
| Tennessee | 5.2 | 6.1 | 6.8 |
| Missouri | 5.8 | 5.5 | 6.3 |
| Maryland | 4.4 | 5.8 | 6.3 |
| Wisconsin | 4.1 | 5.1 | 5.2 |


