Free U.S. Top 10 States by Gig Economy Employment (2018–2025)
The data illustrates a consistent and substantial upward trajectory in the number of Americans participating in the gig economy. In 2018, the workforce began at a robust 56.5 million individuals, marking a solid foundation for this flexible work model. By 2020, participation had increased to 62.3 million, a notable jump that reflects the shifting labor landscape, likely influenced by early pandemic-related changes in employment. The growth continued steadily into 2022, reaching 70.4 million gig workers. The most significant projected increase occurs by the end of this forecast period: by 2025, the U.S. gig workforce is projected to encompass a massive 86.5 million people. This forecast represents a total increase of 30 million workers from the 2018 figure, underscoring the gig economy's emergence as a dominant force in the national labor market.
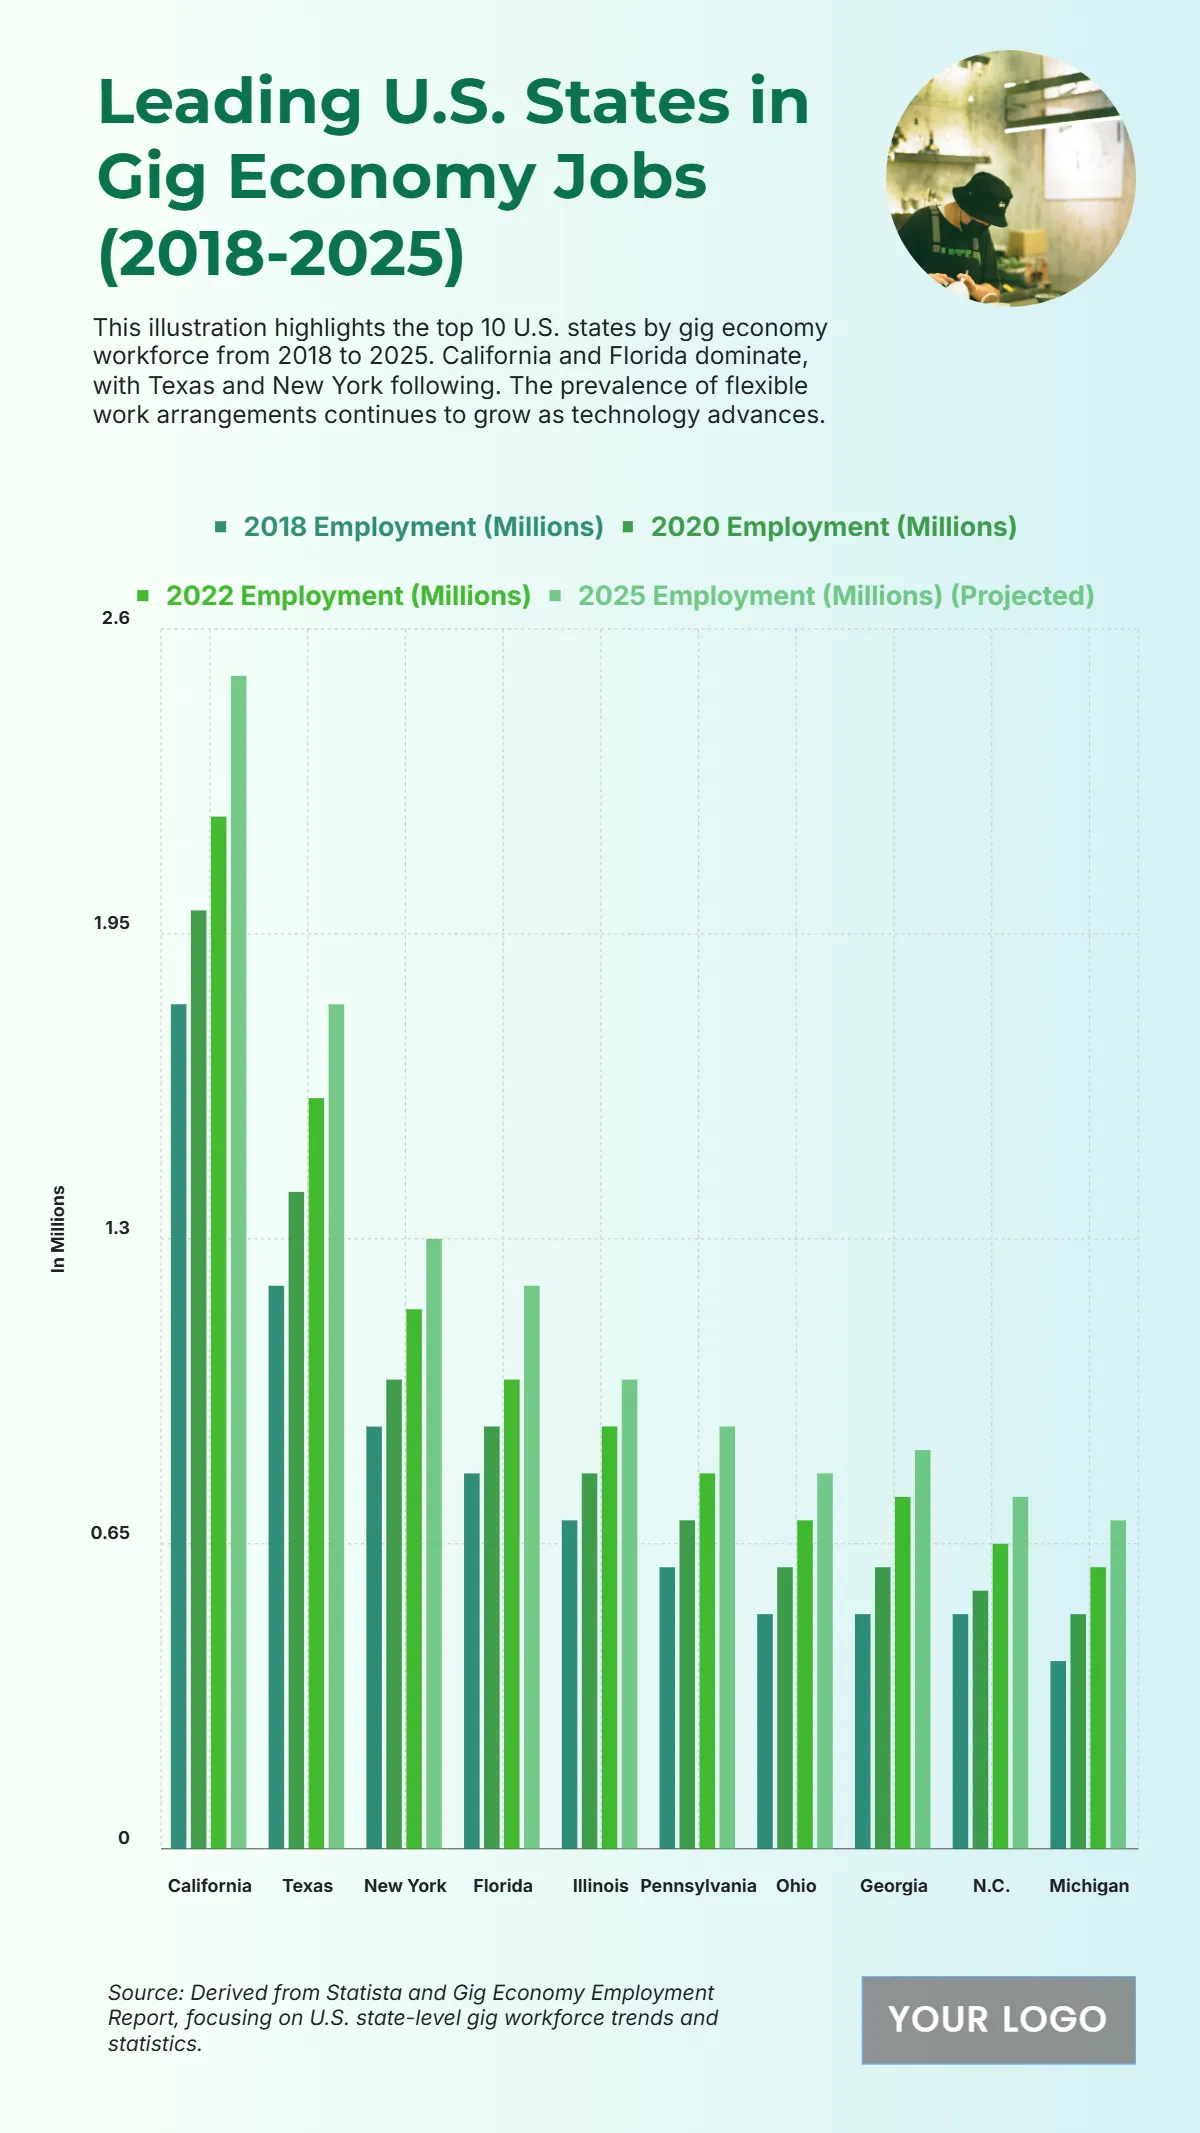
| State | 2018 Employment (Millions) | 2020 Employment (Millions) | 2022 Employment (Millions) |
2025 Projected Employment (Millions) |
| California | 1.8 | 2 | 2.2 | 2.5 |
| Texas | 1.2 | 1.4 | 1.6 | 1.8 |
| New York | 0.9 | 1 | 1.15 | 1.3 |
| Florida | 0.8 | 0.9 | 1 | 1.2 |
| Illinois | 0.7 | 0.8 | 0.9 | 1 |
| Pennsylvania | 0.6 | 0.7 | 0.8 | 0.9 |
| Ohio | 0.5 | 0.6 | 0.7 | 0.8 |
| Georgia | 0.5 | 0.6 | 0.75 | 0.85 |
| North Carolina (N.C.) | 0.5 | 0.55 | 0.65 | 0.75 |
| Michigan | 0.4 | 0.5 | 0.6 | 0.7 |


