Free U.S. Top 5 States with the Highest Income Inequality (2020-2025) Chart
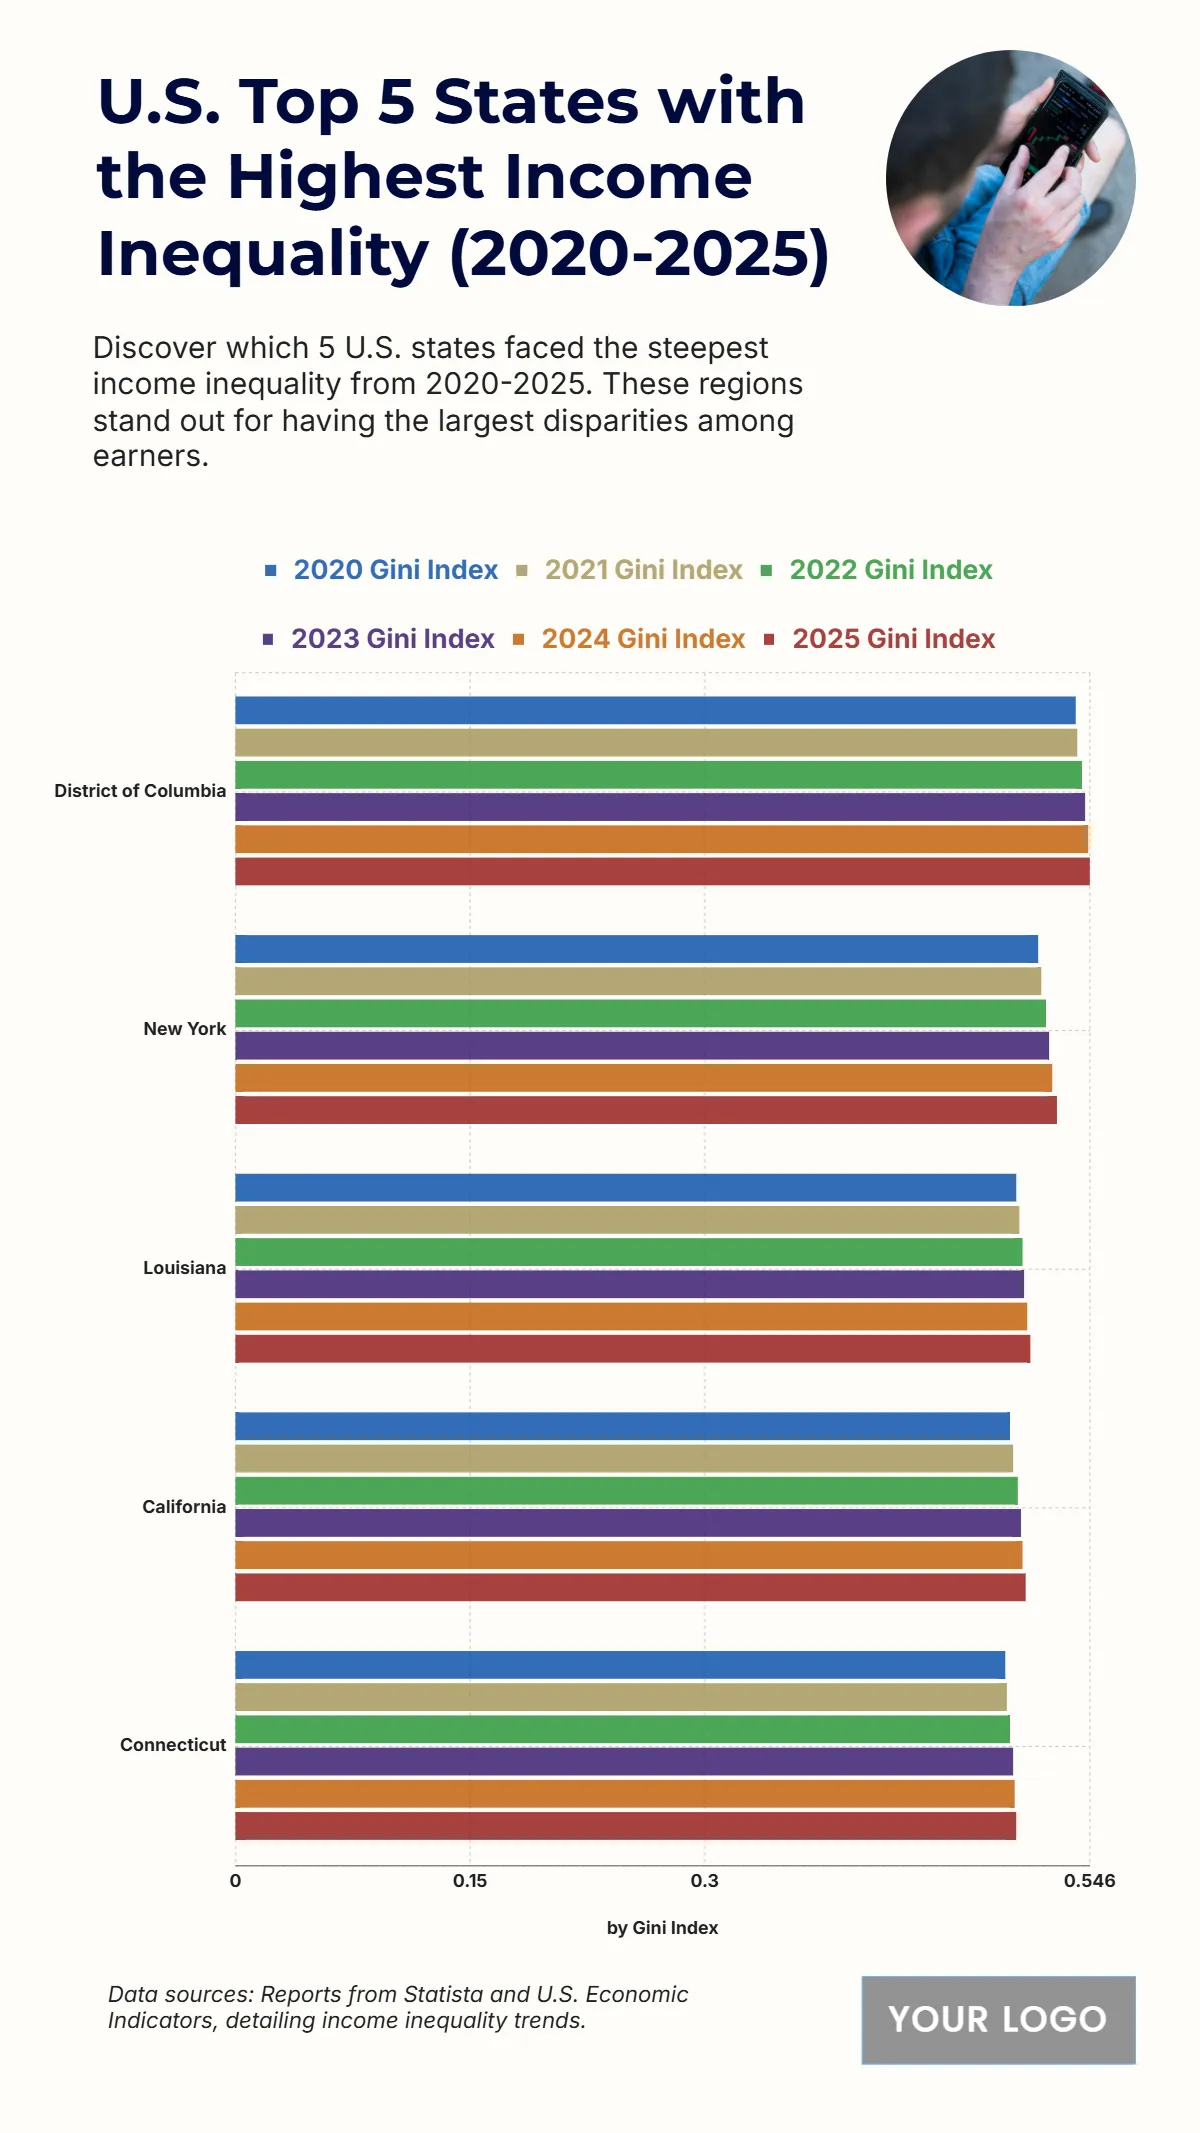
The chart shows that the District of Columbia consistently records the highest income inequality levels, starting with a Gini Index of 0.537 in 2020 and rising steadily to 0.546 in 2025, highlighting persistent and widening disparities. New York follows, increasing from 0.513 to 0.525 across the same period, reflecting a similar upward trend in income gap. Louisiana rises from 0.499 in 2020 to 0.508 in 2025, underscoring growing inequality in the region. California, one of the largest U.S. states, shows an increase from 0.495 to 0.505, indicating moderate but continuous inequality growth. Connecticut has the lowest values in the top five but still climbs from 0.492 to 0.499, reflecting steady but notable disparity expansion. The overall trend across all states signals an upward trajectory in income inequality, suggesting that economic growth is unevenly distributed among residents.
| Labels | 2020 Gini Index | 2021 Gini Index | 2022 Gini Index | 2023 Gini Index | 2024 Gini Index | 2025 Gini Index |
|---|---|---|---|---|---|---|
| District of Columbia | 0.537 | 0.538 | 0.541 | 0.543 | 0.545 | 0.546 |
| New York | 0.513 | 0.515 | 0.518 | 0.520 | 0.522 | 0.525 |
| Louisiana | 0.499 | 0.501 | 0.503 | 0.504 | 0.506 | 0.508 |
| California | 0.495 | 0.497 | 0.500 | 0.502 | 0.503 | 0.505 |
| Connecticut | 0.492 | 0.493 | 0.495 | 0.497 | 0.498 | 0.499 |


