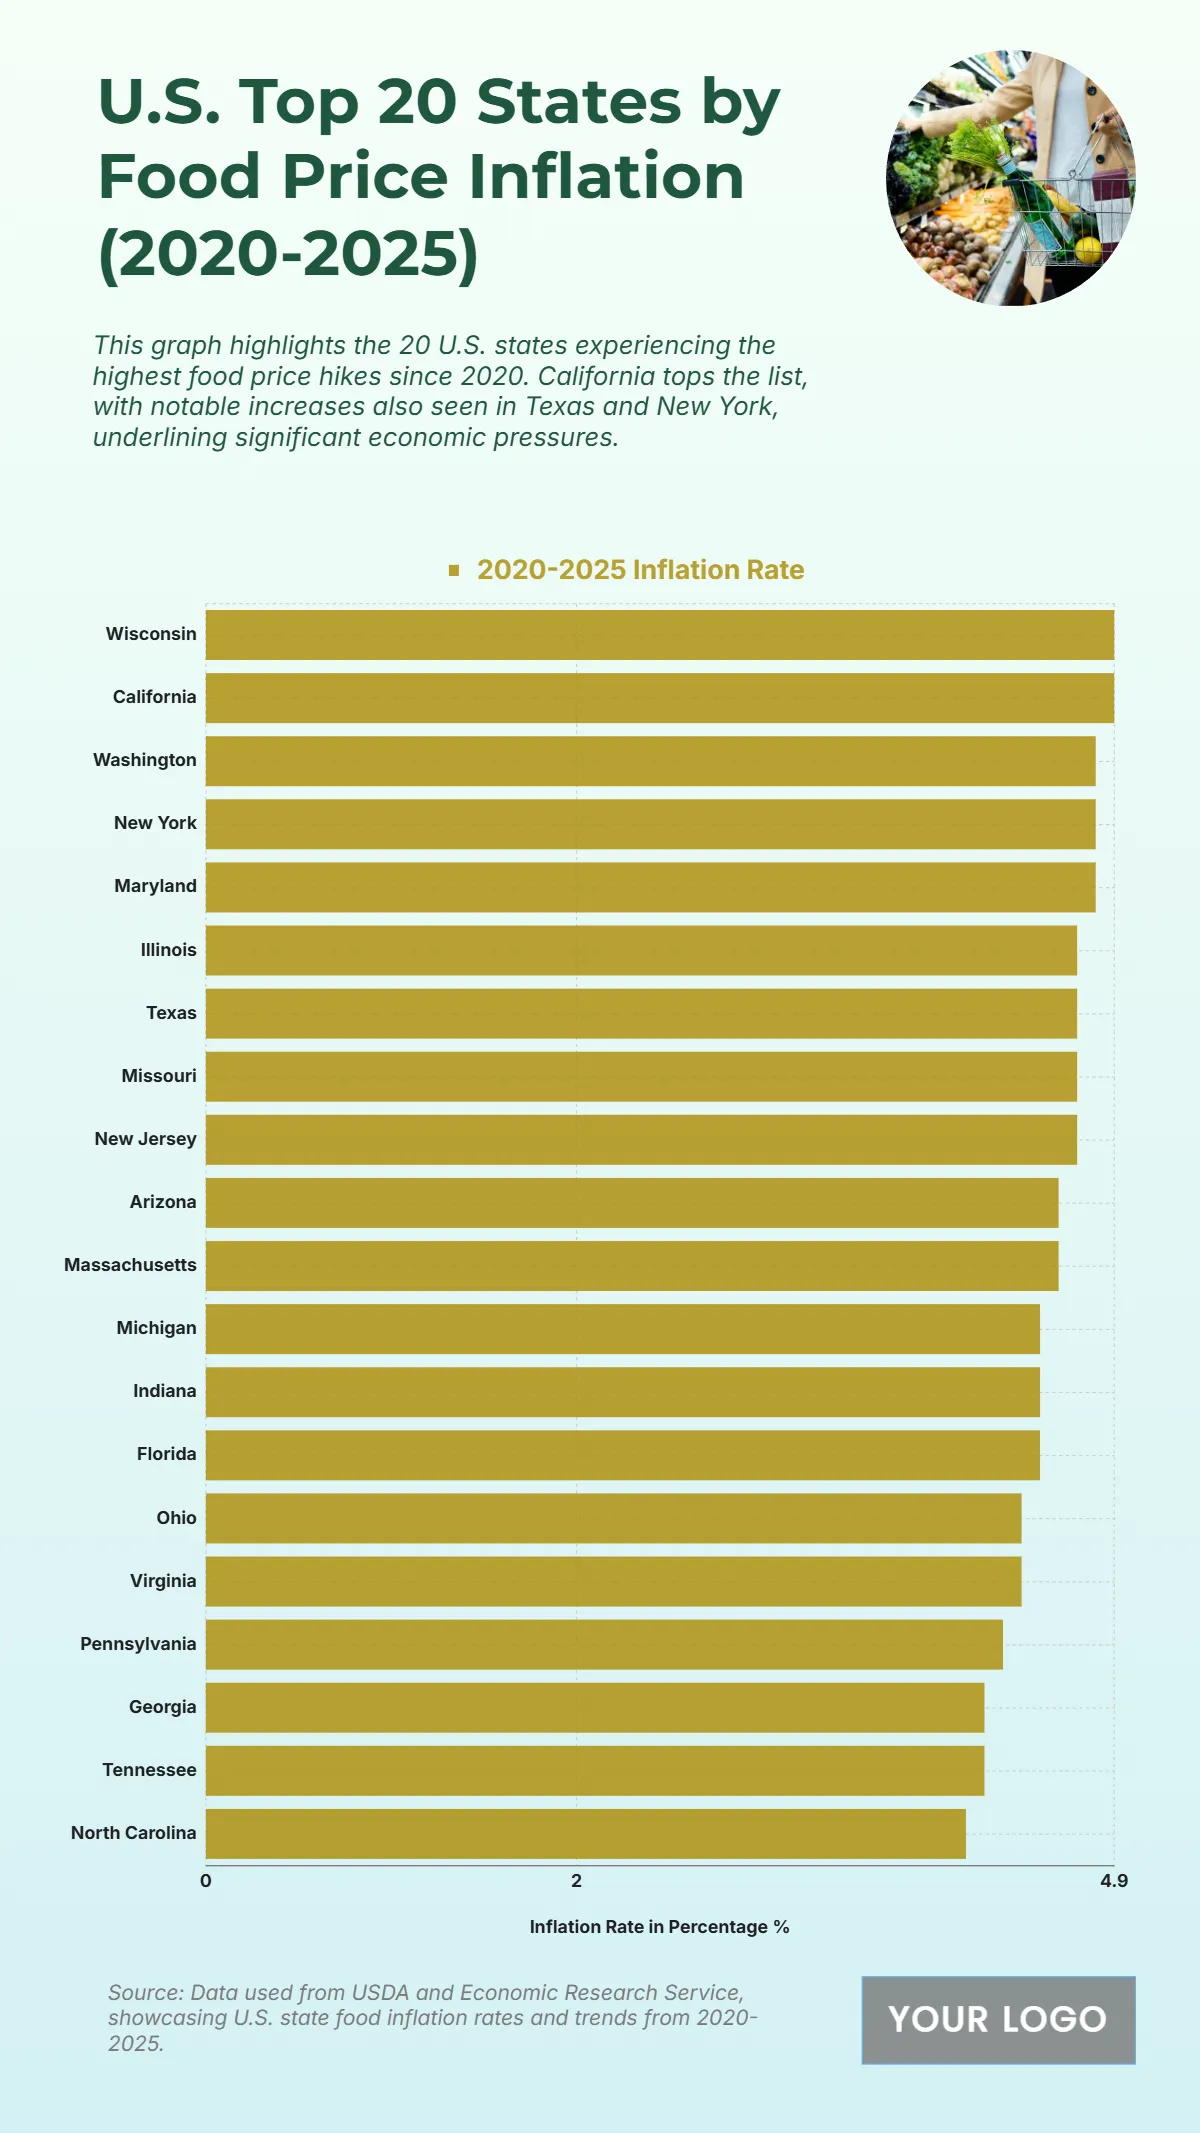
The chart highlights the top 20 U.S. states with the highest food price inflation from 2020 to 2025, revealing widespread cost increases across the country. Wisconsin ranks first, with inflation rates nearing 5%, reflecting supply chain disruptions and rising agricultural costs. California follows closely, driven by higher production and transportation expenses affecting its vast food markets. Washington and New York record similar inflation pressures, hovering just below 4.8%, due to urban demand and import-related costs. Maryland, Illinois, and Texas also experience steep hikes, with rates around 4.6–4.7%, signaling the strain on regional consumers. States such as Missouri, New Jersey, and Arizona show marginally lower but still significant increases tied to energy and distribution expenses. Toward the lower range, Tennessee, Georgia, and North Carolina remain near 4.3%, yet still above the national average. Overall, the chart reflects sustained inflationary pressure nationwide, highlighting economic vulnerabilities and persistent cost-of-living challenges affecting households through 2025.
| Labels |
2020-2025 Inflation Rate |
| Wisconsin | 4.9 |
| California | 4.9 |
| Washington | 4.8 |
| New York | 4.8 |
| Maryland | 4.8 |
| Illinois | 4.7 |
| Texas | 4.7 |
| Missouri | 4.7 |
| New Jersey | 4.7 |
| Arizona | 4.6 |
| Massachusetts | 4.6 |
| Michigan | 4.5 |
| Indiana | 4.5 |
| Florida | 4.5 |
| Ohio | 4.4 |
| Virginia | 4.4 |
| Pennsylvania | 4.3 |
| Georgia | 4.2 |
| Tennessee | 4.2 |
| North Carolina | 4.1 |


