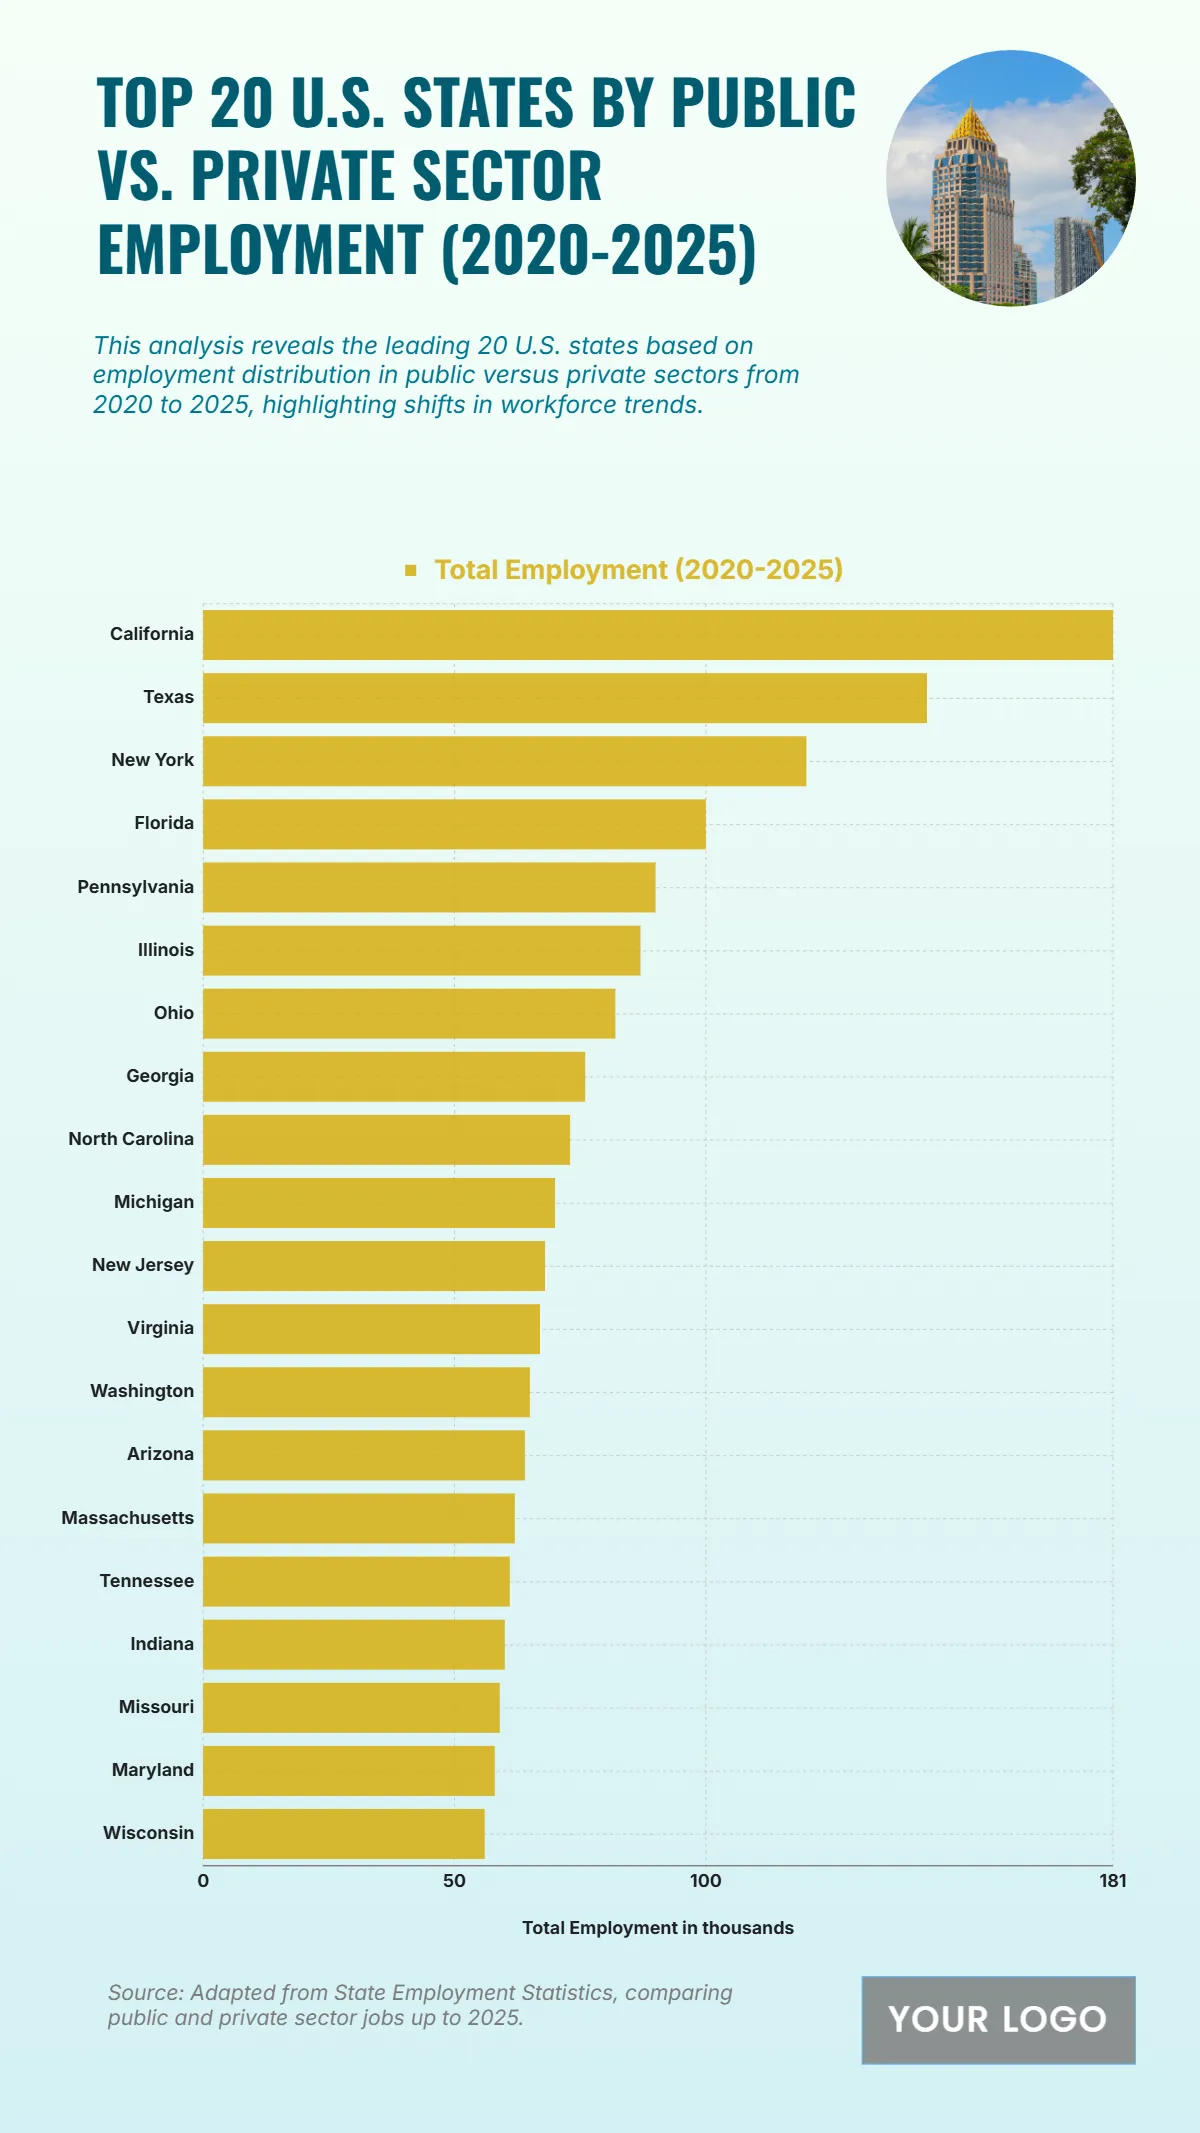
Free Top 20 U.S. States by Public vs. Private Sector Employment (2020-2025) Chart
The chart displays the top 20 U.S. states by combined public and private sector employment from 2020 to 2025, reflecting workforce concentration and economic activity across regions. California leads significantly, surpassing 180,000 total jobs, driven by its robust tech, education, and government sectors. Texas follows closely with about 160,000 jobs, fueled by rapid industrial and service-sector expansion. New York secures third place with roughly 130,000 positions, balancing finance, healthcare, and public employment growth. Florida and Pennsylvania maintain totals near 110,000–120,000, underscoring strong tourism, logistics, and education employment bases. Mid-ranking states like Illinois, Ohio, and Georgia show consistent employment between 90,000–100,000, supported by manufacturing and trade. Meanwhile, states such as North Carolina, Virginia, and Washington sustain steady job creation, each near 85,000–95,000. The lower segment, including Massachusetts, Indiana, and Wisconsin, averages around 70,000–80,000 jobs. Overall, the chart emphasizes how diverse economic structures and public-private employment balance continue to shape state-level labor markets through 2025.
| Labels |
Total Employment (2020-2025) |
| California | 181 |
| Texas | 144 |
| New York | 120 |
| Florida | 100 |
| Pennsylvania | 90 |
| Illinois | 87 |
| Ohio | 82 |
| Georgia | 76 |
| North Carolina | 73 |
| Michigan | 70 |
| New Jersey | 68 |
| Virginia | 67 |
| Washington | 65 |
| Arizona | 64 |
| Massachusetts | 62 |
| Tennessee | 61 |
| Indiana | 60 |
| Missouri | 59 |
| Maryland | 58 |
| Wisconsin | 56 |


