Free Top 10 U.S. States by State-Level Credit Market Growth (2018-2025)
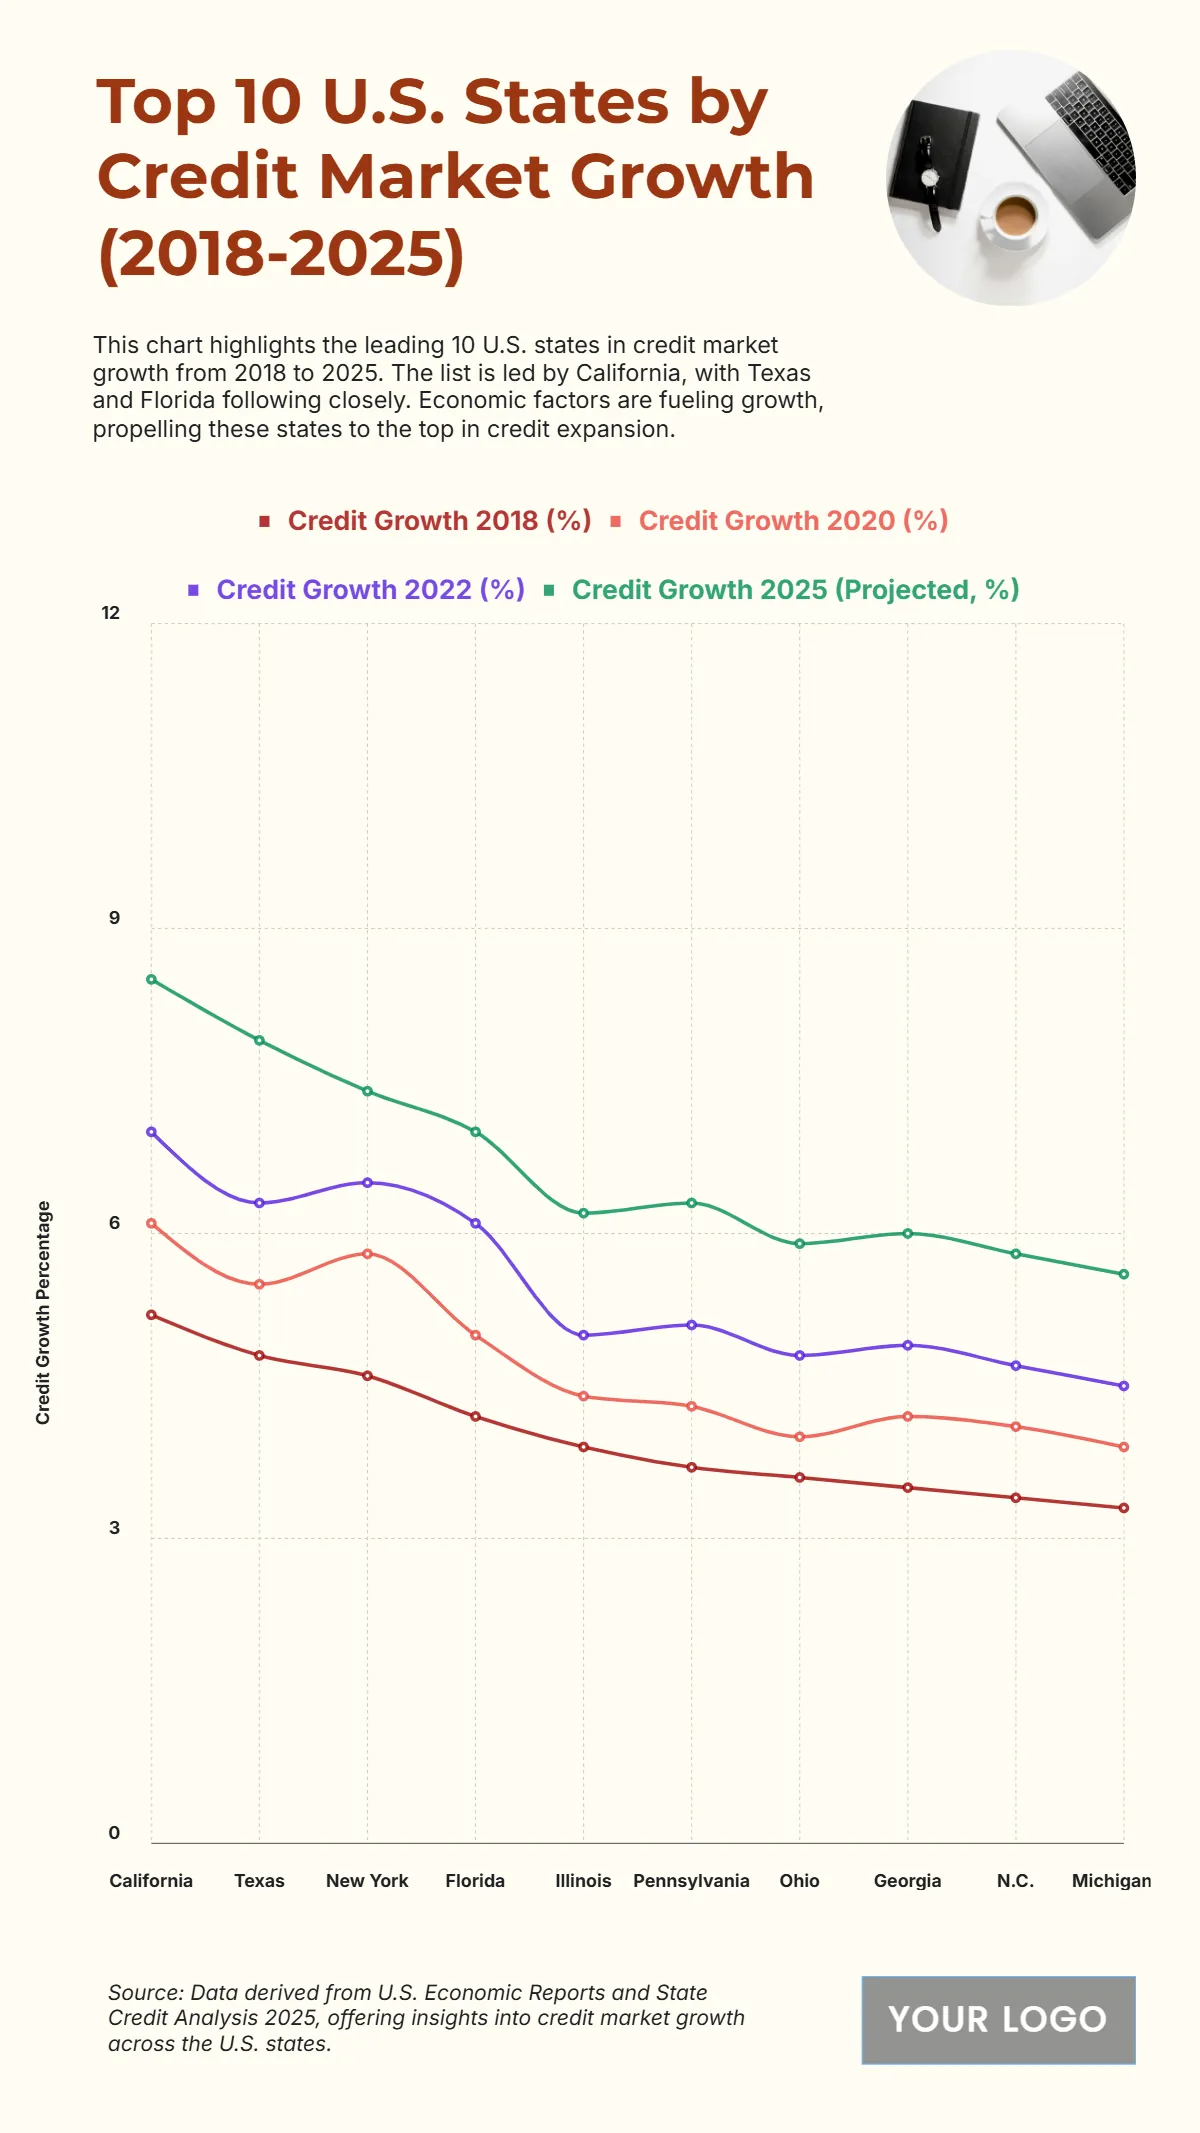
The chart highlights the top ten U.S. states leading in credit market growth from 2018 to 2025, emphasizing expanding consumer lending and financial activity. California maintains the strongest position, with credit growth projected at around 9% in 2025, driven by a robust housing market and increased consumer borrowing. Texas follows closely at 8.5%, reflecting steady population growth and rising credit demand. New York records approximately 7.8%, supported by its diverse financial ecosystem and investment trends. Florida and Illinois each post growth near 7%, signaling strong retail and housing loan expansion. States such as Pennsylvania, Ohio, and Georgia show moderate gains between 6% and 6.5%, while North Carolina and Michigan report slightly lower but stable figures at 5.8% and 5.6%, respectively. Overall, the chart underscores a decade of healthy credit expansion, with economic optimism and improved lending accessibility fueling continued market momentum.
| Labels | Credit Growth 2018 (%) | Credit Growth 2020 (%) | Credit Growth 2022 (%) |
Credit Growth 2025 (Projected, %) |
| California | 5.2 | 6.1 | 7 | 8.5 |
| Texas | 4.8 | 5.5 | 6.3 | 7.9 |
| New York | 4.6 | 5.8 | 6.5 | 7.4 |
| Florida | 4.2 | 5 | 6.1 | 7 |
| Illinois | 3.9 | 4.4 | 5 | 6.2 |
| Pennsylvania | 3.7 | 4.3 | 5.1 | 6.3 |
| Ohio | 3.6 | 4 | 4.8 | 5.9 |
| Georgia | 3.5 | 4.2 | 4.9 | 6 |
| N.C. | 3.4 | 4.1 | 4.7 | 5.8 |
| Michigan | 3.3 | 3.9 | 4.5 | 5.6 |


