34+ Chart Templates
Presentations are made to deliver information to interested parties. Texts and illustrations form part in the composition of a presentation. Illustrations pertain to the visual representations of the information being presented which is what we call a chart.

Creating a chart as a result of the tabulation of data helps in the effective delivery of the purpose for presentation. It is similar to an organizational chart in that the information presented in both charts is necessary in determining the next course of action. Chart templates provided on this website are available for you to peruse or to download to help you in making an informative presentation.
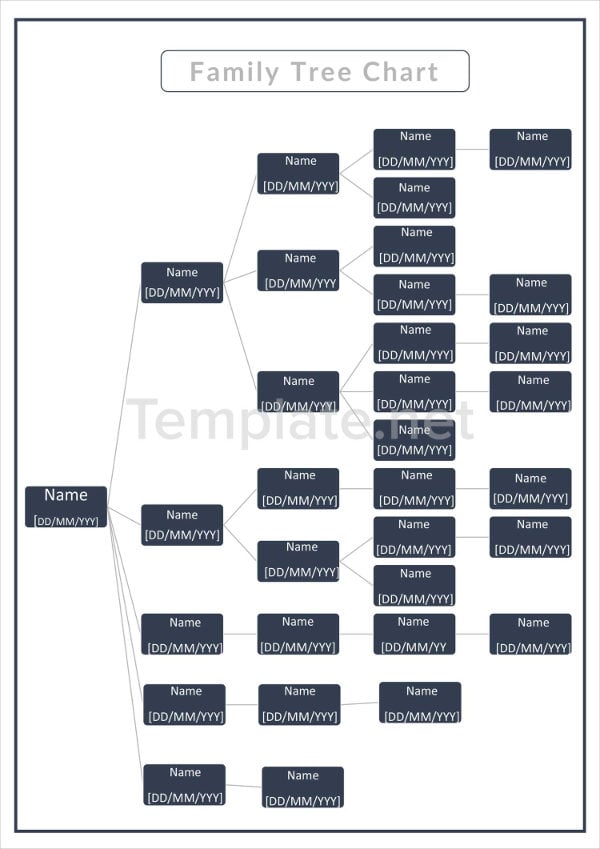
Family Tree Chart Template
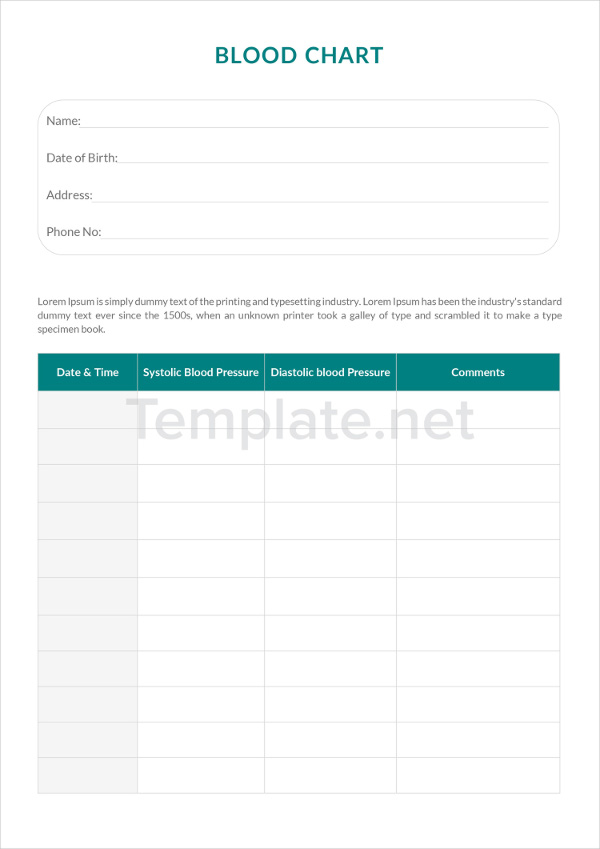
Blood Chart Template
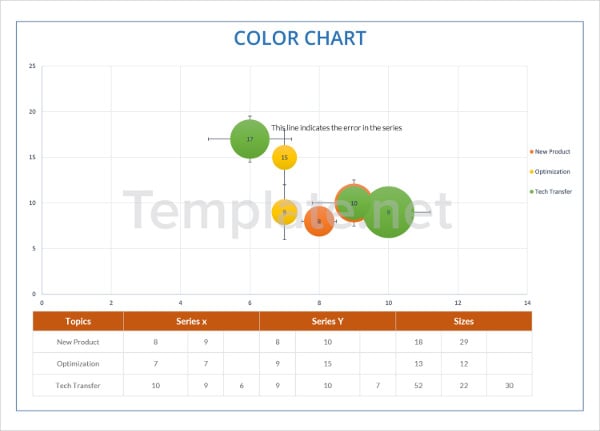
Color Chart Template
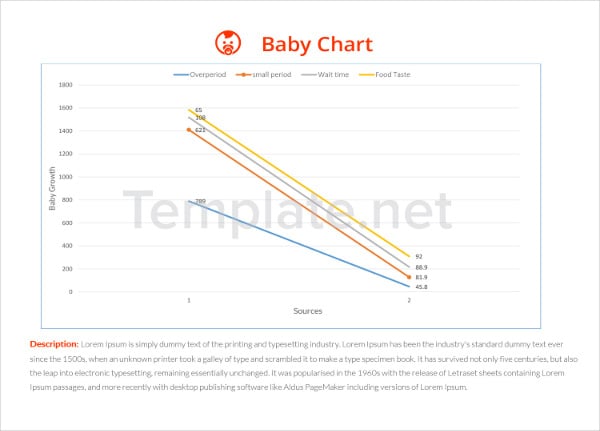
Baby Chart Template
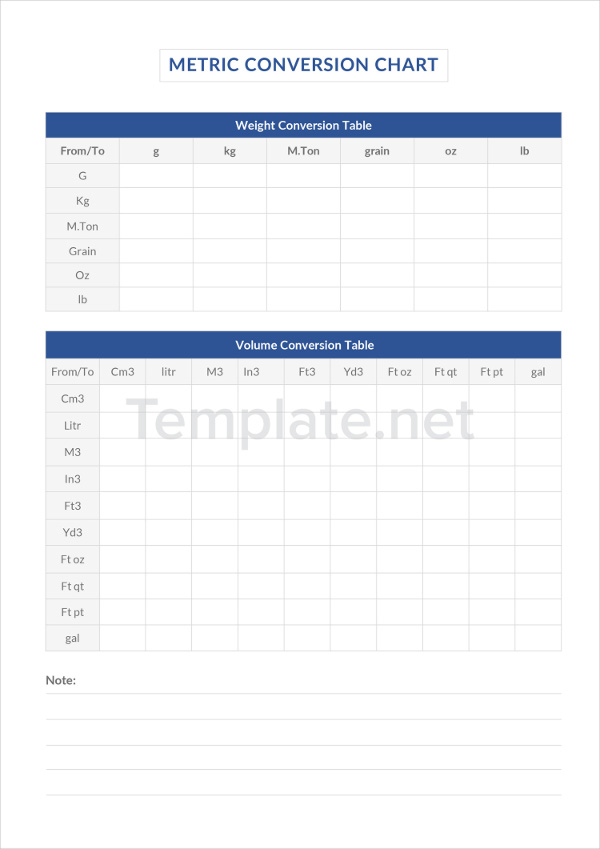
Metric Conversion Chart Templates
What Is a Chart?
Also known as graph, a chart serves as a representation of numerical or qualitative data in the form of diagrams and figures. Information is incorporated into a chart for better understanding and analysis.
Charts are especially used for decision-making purposes of business entities and various other institutions.
Examples of charts presented on this website are conversion charts, growth charts and bubble chart templates.
Essential Elements in Charts
The following features are usually present regardless of chart type as presented on sample chart templates:
- Chart Title – The description of the graph along with the data being presented is written at the top of the chart.
- Axes – This pertains to the vertical and horizontal lines with a numerical scale. The scale is labeled with according to the numerical data being presented.
- Grid Lines – These lines are usually added for better emphasis on the graduations within the chart. This applies to a few chart types especially line charts.
- Data Labels – Data is presented using different formats that depend on the type of chart used. Plotting the data on the chart is made with the use of symbols and shapes along with the text label regarding the data.
- Legend – Variables in the chart are listed on the legend section as a means in determining what data is presented for each variable plotted on the chart.
Price Chart Templates
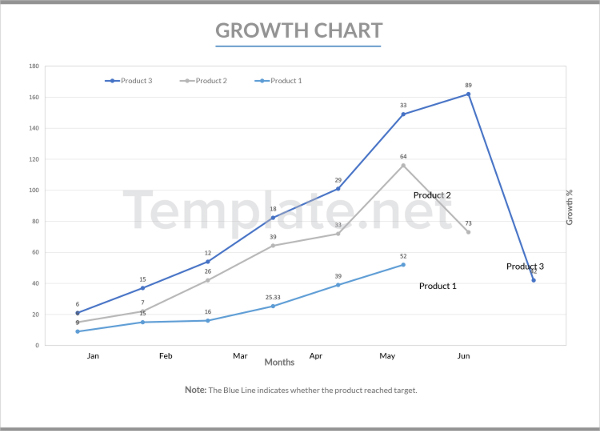
Growth Chart Templates
Food Chart Templates
Rate Chart Templates
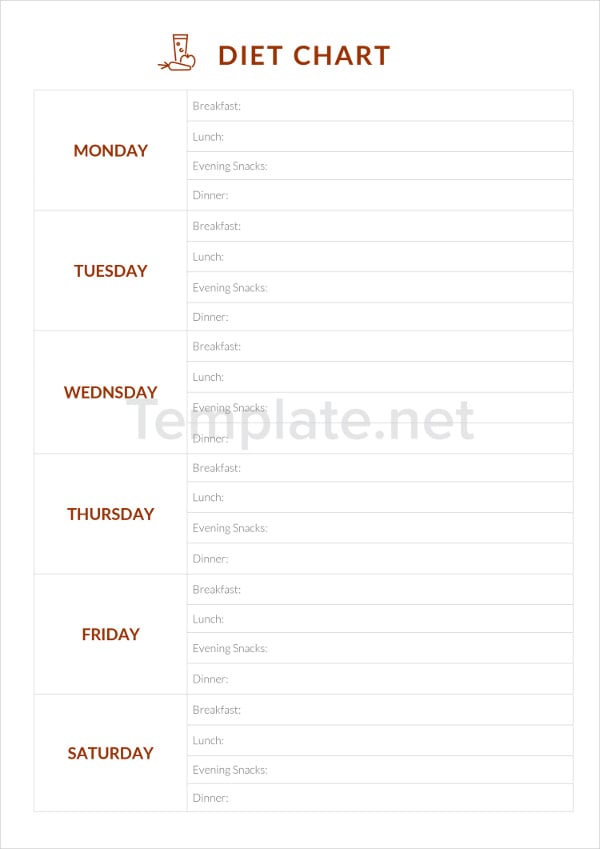
Diet Chart Templates
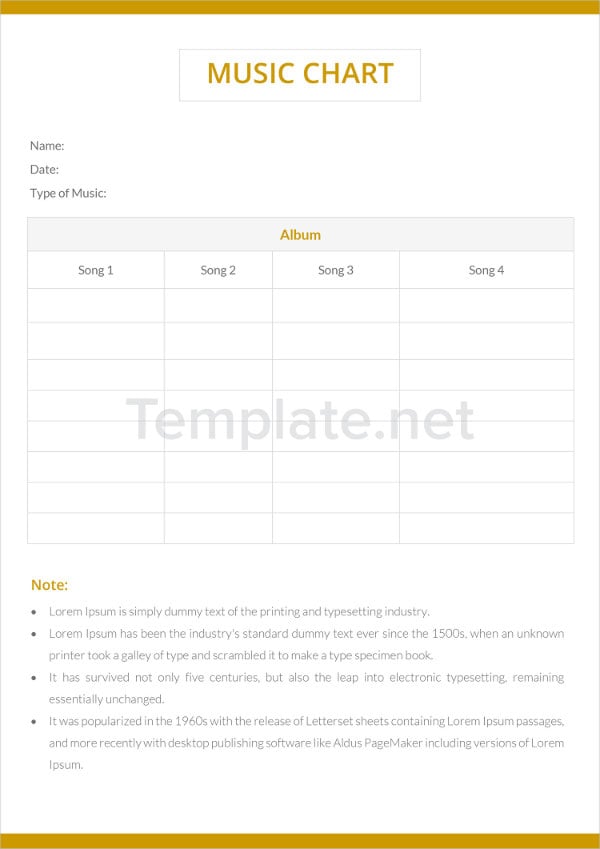
Music Chart Templates
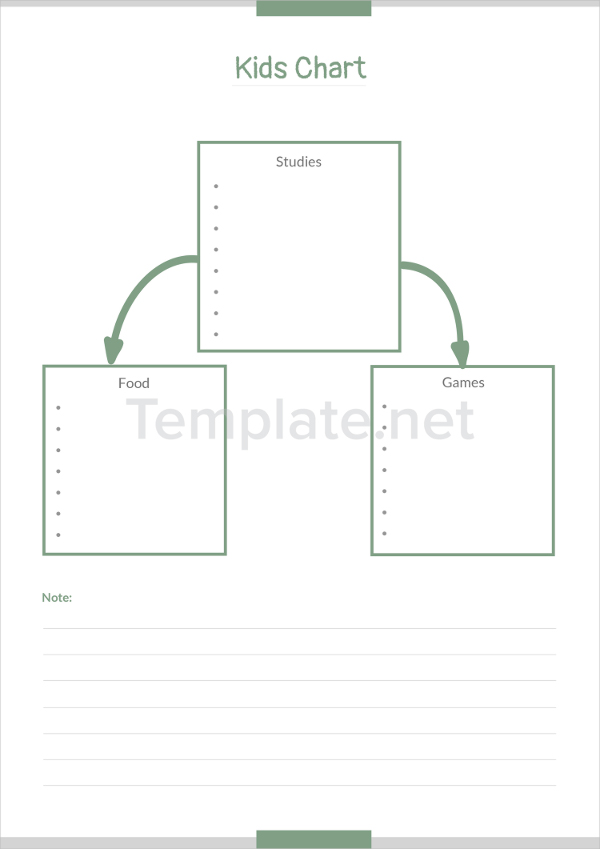
Kids Chart Templates
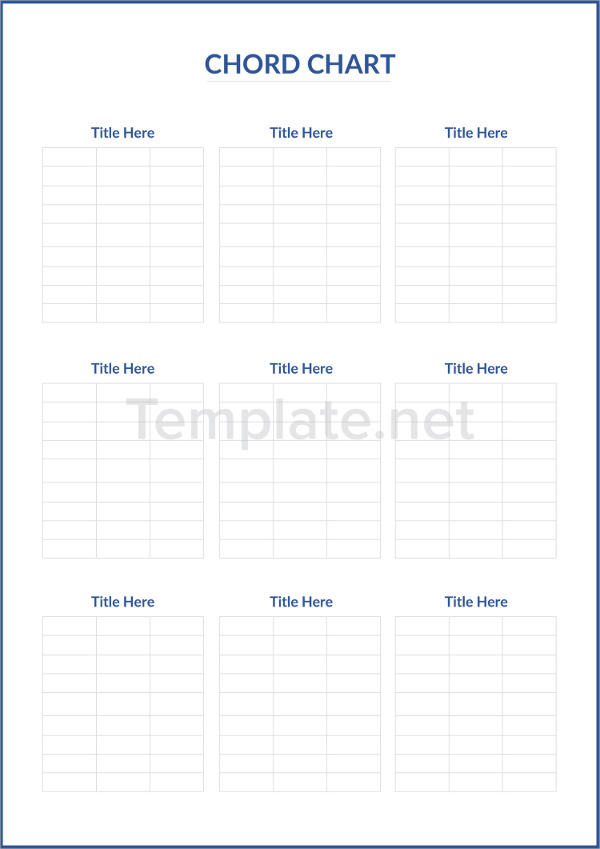
Chord Chart Templates
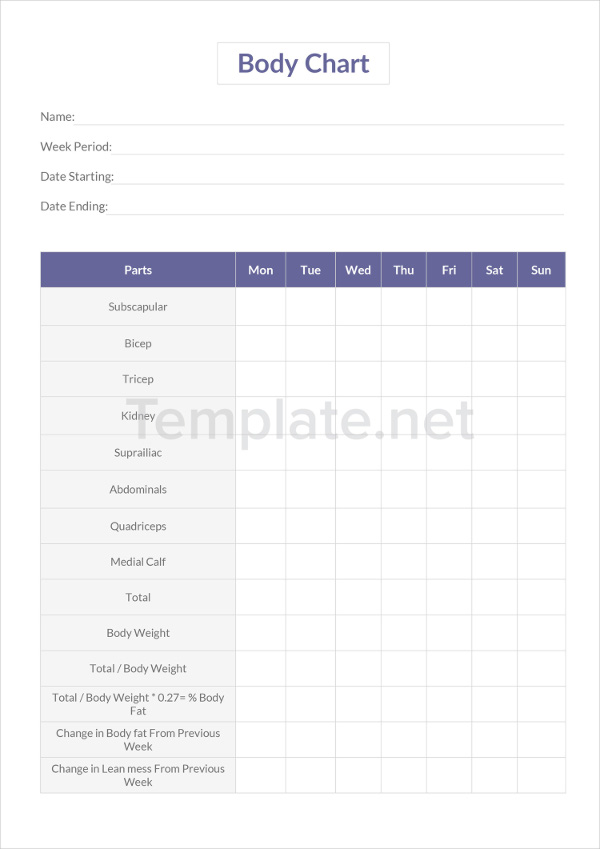
Body Chart Templates
Basic Types of Charts
The following are the different types of charts, each with its own function and purpose:
- Line Chart – This chart is used to determine the rise and fall of specific trends, such as gas prices or the value of stocks. Goal chart templates have examples of line charts used to determine the achievement of business goals.
- Point Chart – This chart is used by traders to determine the movement of prices. It allows analysts to estimate whether a price target can be achieved or not.
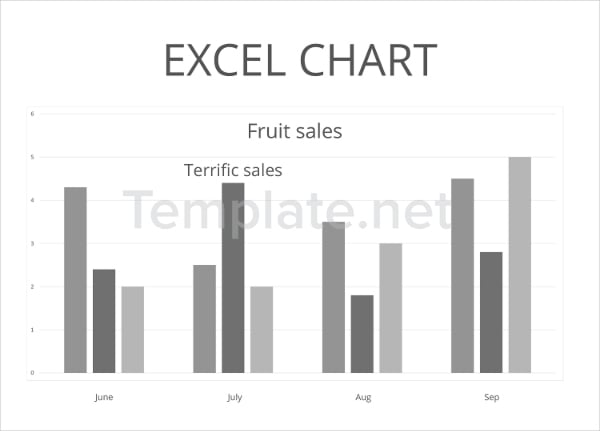
- Bar Chart – This is used to compare one category of data to others. It is often used for data with long labels.
- Column Chart – Similar to a bar graph in that it is used to compare several values, it is a better choice when some of those values are negative.
- Pie Chart – This shows percentage of values similar to slices of an actual dessert pie.
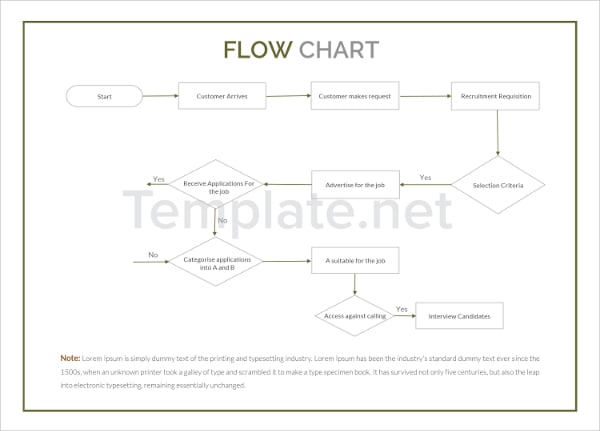
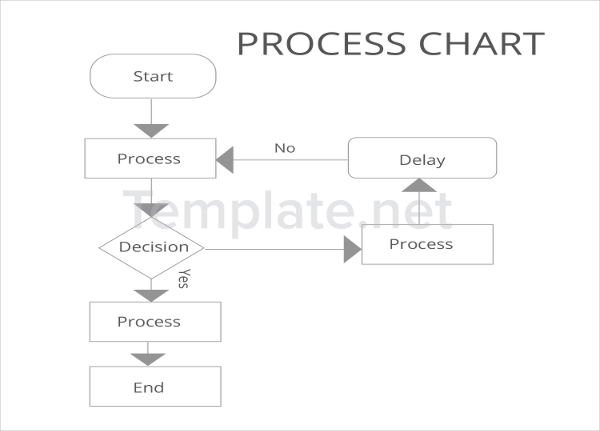
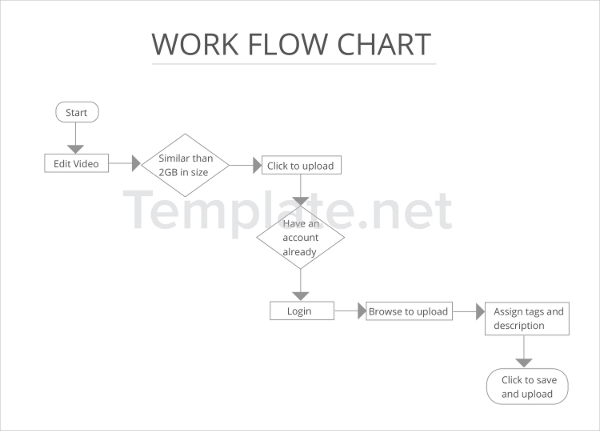
- Flow Chart – This is a sequential graph of procedures displays the flow of certain procedures and processes.
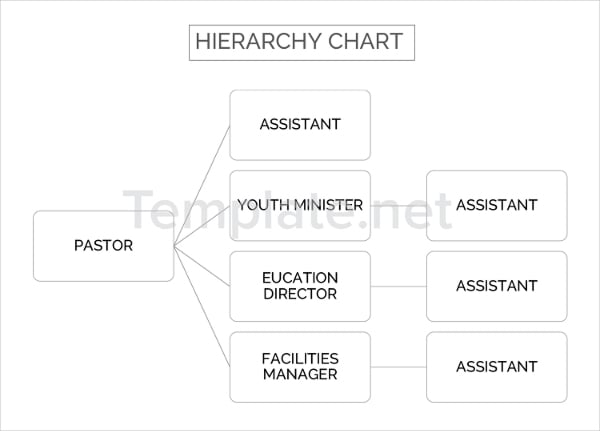
- Organizational Chart – A structure of an organization is determined. It displays the ranks and job positions of each individual, and identifies which individual is in charge of which.
- Gantt Chart – This is one of a few known named charts which is used to schedule various projects.
There is a wide variety of charts which is used for specific purposes such as stock prices, navigation, and field work. But these types are the most used charts in business, in academic, in bank, in government and in other institutions as shown on the blank chart templates presented on this website.
Age Chart Templates
Hair Chart Templates
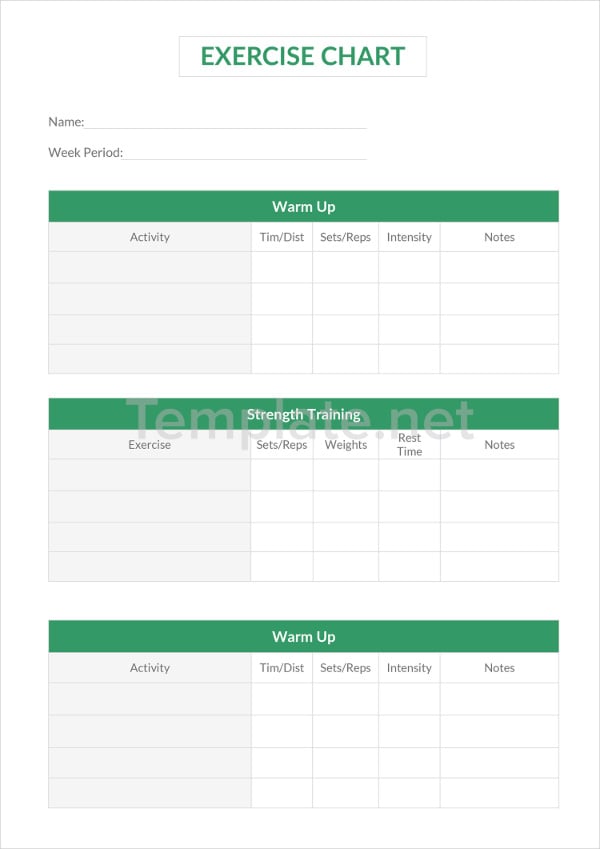
Exercise Chart Templates
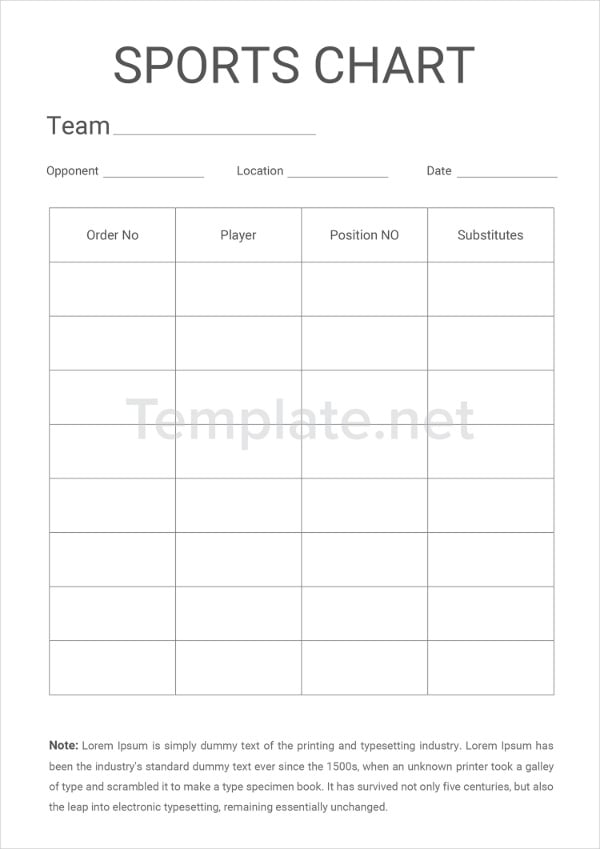
Sports Chart Templates
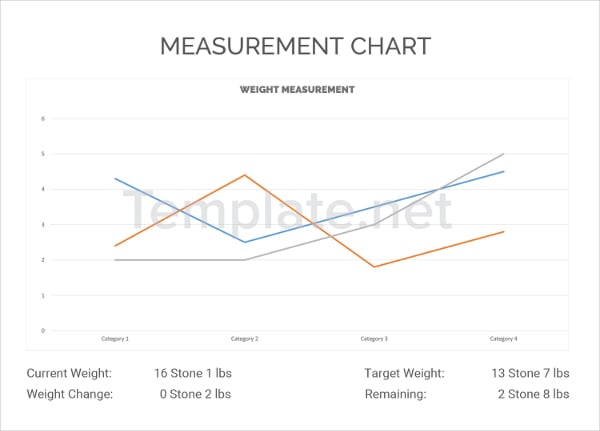
Measurement Chart Templates
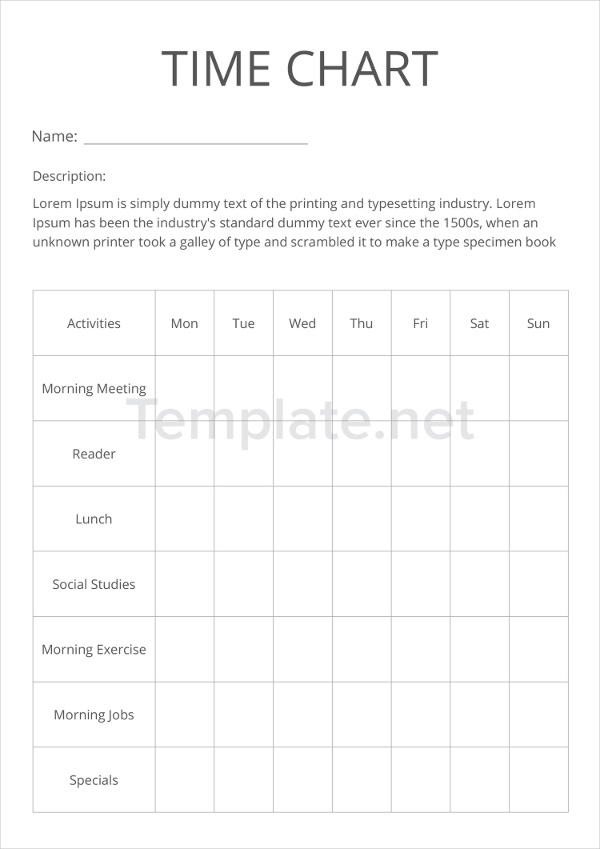
Time Chart Templates
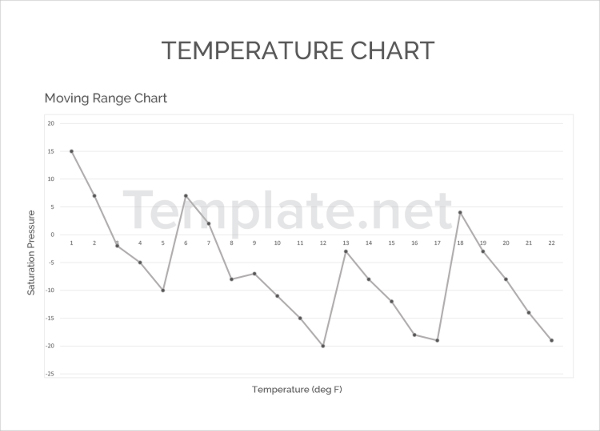
Temperature Chart Templates
Flow Chart Templates
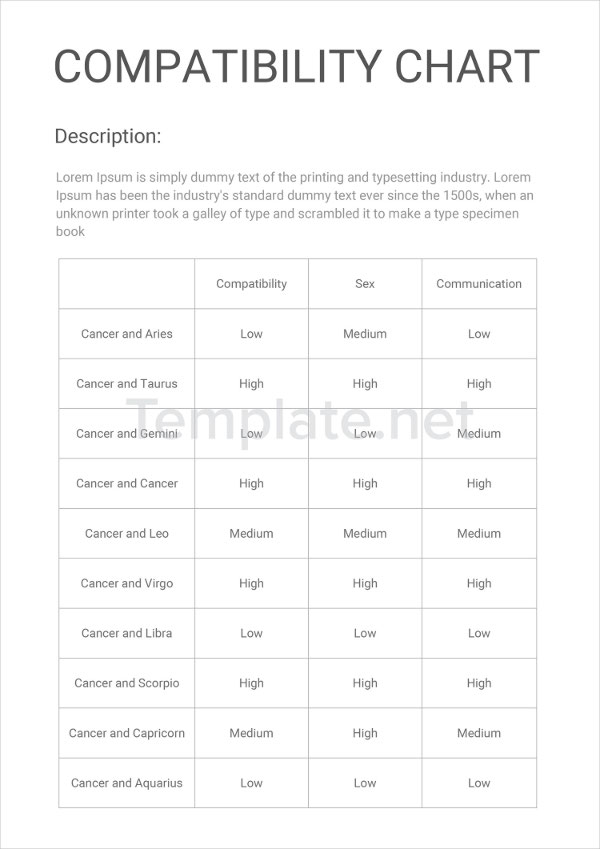
Compatibility Chart Templates
Purposes of Charts
Charts are used to represent data for the following purposes:
- To show comparison between data. Charts are used to determine growth and/or progress of a certain entity for a specific period of time. Charts can also be used by production companies to know which product sells is doing well and which is not. Simple chart templates, such as line and bar charts are used for this purpose.
- To know relationship of information. Charts for such purpose like the Venn Diagram show correlation of information useful in creating business strategies.
- To see distribution of various data. Allocation of information is seen clearly when you show the data using charts. Medication chart templates show chart examples used for this purpose.
- To present market trends. To know the market conditions in preparing for an entity’s market strategies, a chart is generated based on the market research information acquired on a given period.
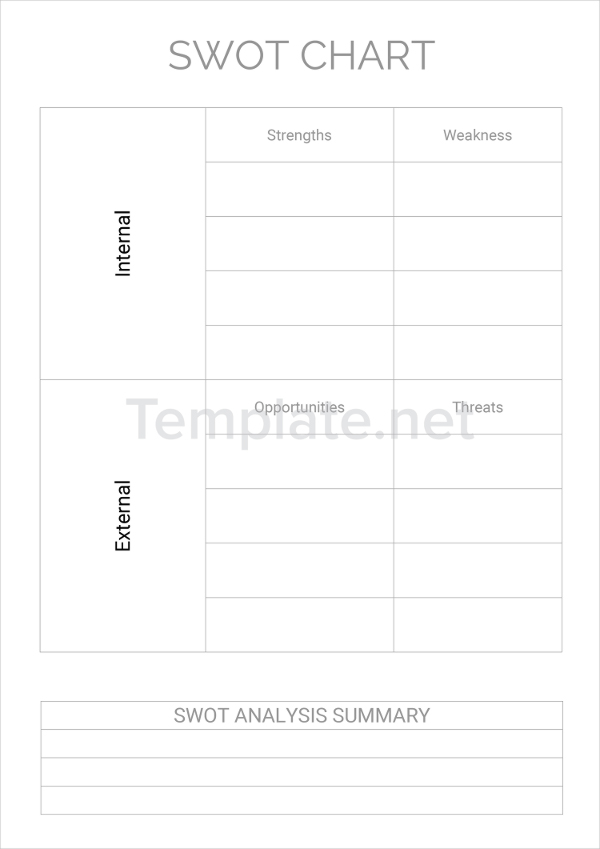
- To aid in making decisions. Charts are used by entities in coming up decisions for particular issues and concerns. For this purpose, chart templates in Word provide charts like flow and SWOT charts commonly used for decision-making.
- To know composition of a particular data. Pie chart templates are examples of charts providing percentage compositions of information from surveys or research of a certain company concern.
Process Chart Templates
Excel Chart Templates
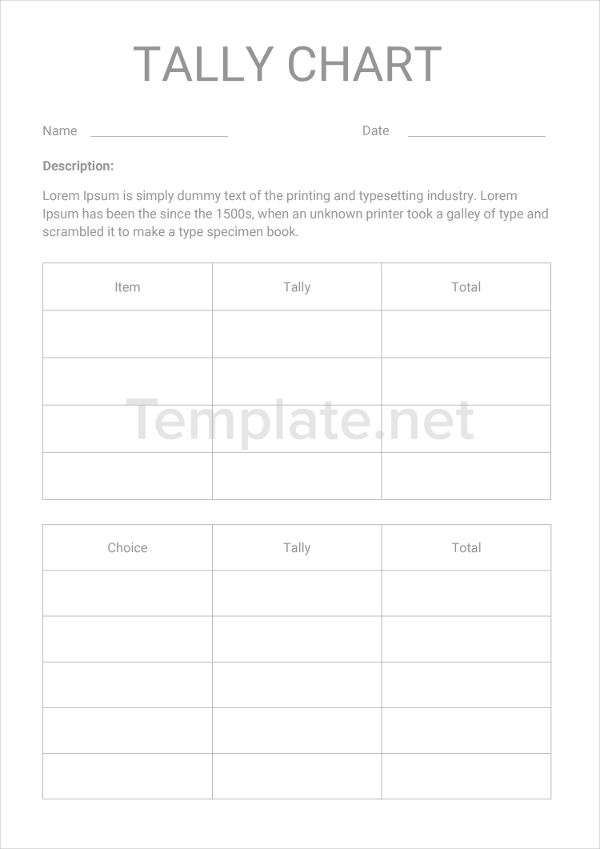
Tally Chart Templates
SWOT Chart Template
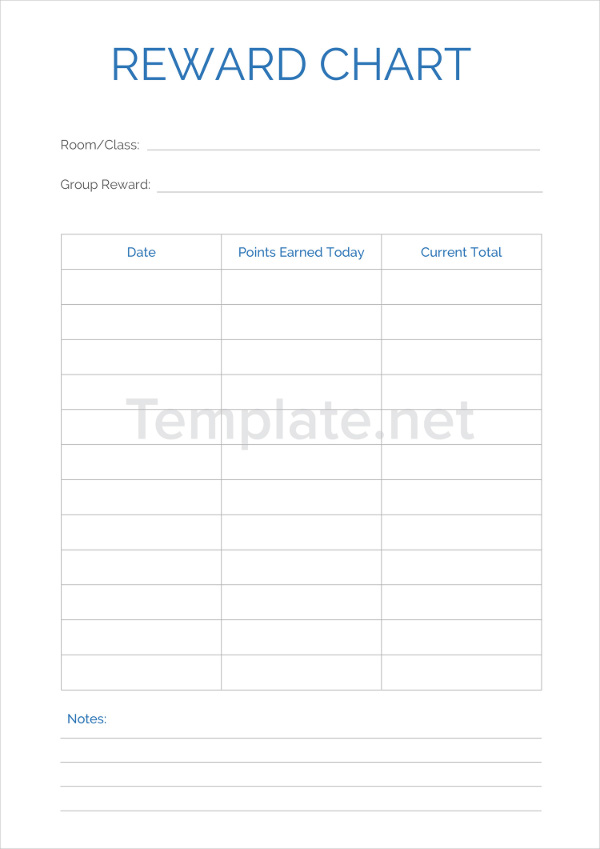
Reward Chart Templates
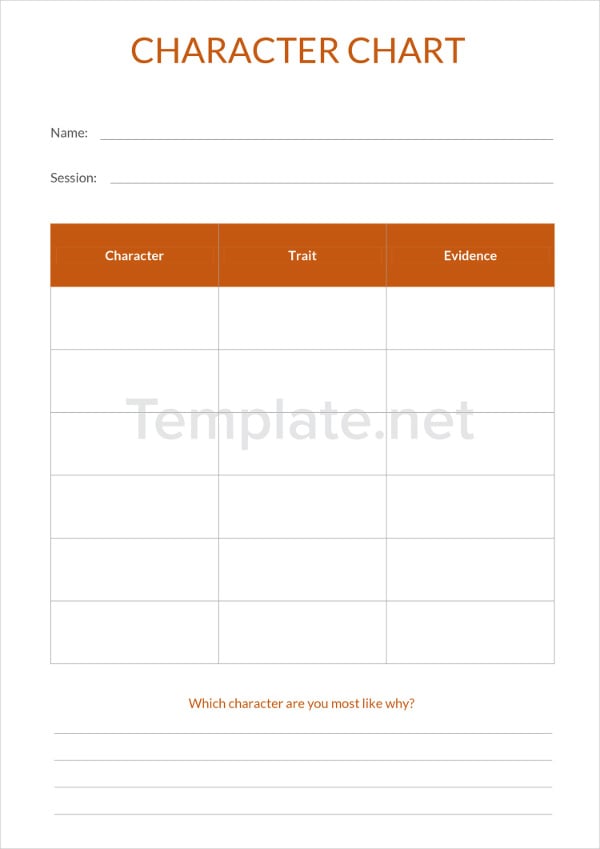
Character Chart Template
Work Flow Chart Templates
Hierarchy Chart Template
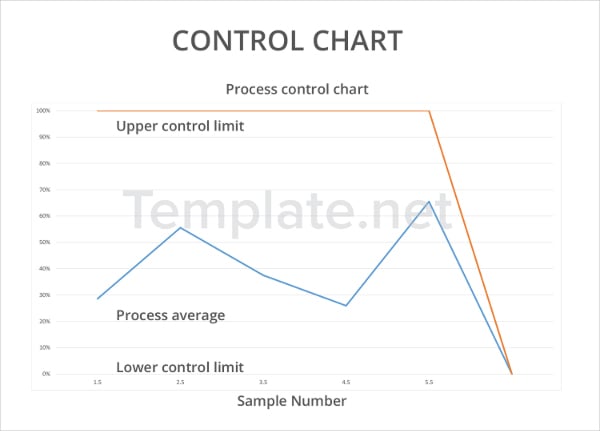
Control Chart Template
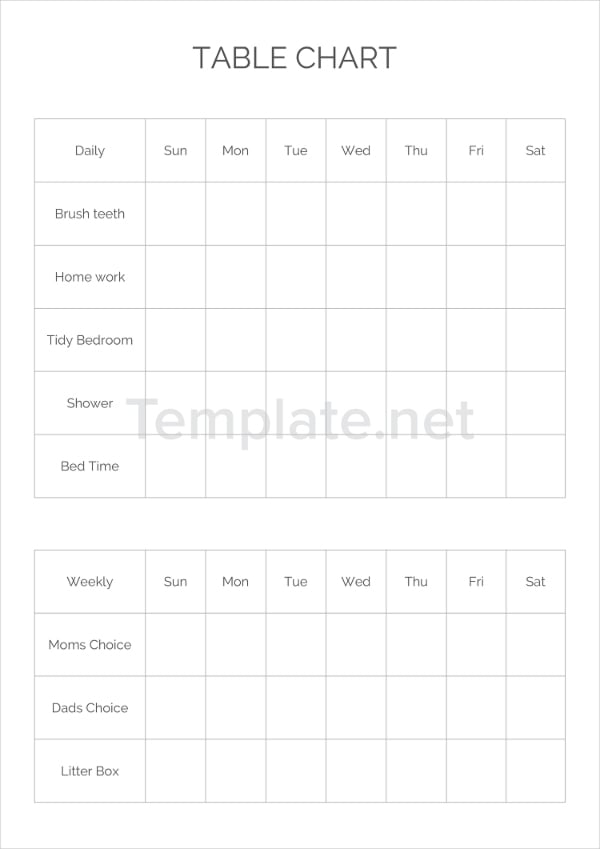
Table Chart Templates
Timeline Chart Templates
A Guide in Using the Right Chart for Presentations
Knowing all the different kinds of charts is the first step in preparing for your presentations. Another step to take is to pick the most appropriate chart format for the information you are going to present. Here is a guide you can follow in choosing charts for your data presentation:
- Know the purpose of presenting data. Choose the chart that allows you to emphasize the implications you want to convey. For example, if the reason for data gathering is to know how many customers are satisfied with the business entity’s products or services, pie charts can be your choice of graph presentation due to its composition feature.
- Utilize various templates. Printable chart templates are available on the web for your perusal. For psychiatric or academic kinds of data, behaviour chart templates can be your guide in monitoring behavior of clients or students.
Presentations are effective with the use of illustrations such as charts. Data is presented to the interested audience for the purpose of better understanding to generate right decisions and strategies. With the help of these chart templates, making a chart can be accomplished without much hassle on your part.


