Create A Chart in Microsoft Word 2010 Instantly
The core and most essential feature of Microsoft Word is its user-friendliness. Microsoft Word (or MS Word or simply Word) gives the user one of the most likeable user interfaces of any application. Whether you want to type a text, or create a business presentation, Word gives you one of the most easy-to-use interfaces. It offers you wide range of options to work with , and at the same time the ease of automation to save important time.

In Microsoft Word 2010, user can work with huge amount and variety of data through charts and graphs, such as column charts, line graphs, pie charts, bar charts, stock charts, surface charts, unit circle chart word, bubble graphs, and radar graphs.
Before we move on to the step-by-step process, it should be noted that all the applications in MS Office suite are intelligently integrated and compatible with each other. When we are working on a tool, for instance charts, MS Word automatically integrates MS Excel window. This gives the user the ease and flexibility of working with huge data and great figures.
The Process
Let’s have a look at the step-by-step process of creating different kinds of chart templates in MS Word.
1. This is the ‘Menu’, where all the functions are categorized in ‘tabs’; File, Home, Insert, Page Layout, References, Mailings, Review and View.

2. Each of the tabs holds its own groups. The space that shows the groups is called ‘ribbon’, which can be maximized to permanently show all the functions or minimize to temporarily hide the functions as the requirement. The Insert tab holds many functions categorized in various groups such as pages, tables, illustrations, links, text and symbols.

3. On the Insert tab, you can find the ‘Illustrations’ group. Illustrations, as the name suggests, holds the option of inserting images from various sources. Picture, Clip Art, Shapes, Smart Art, Chart and Screenshot are options from where user can insert images in the word file.

4. In the Illustrations group, click on ‘Chart’ option. A chart dialogue box will open in a window. [Gantt Chart Template]
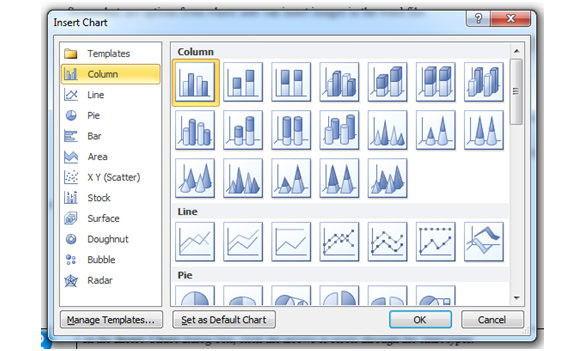
5. In the Insert Chart dialogue box, scroll through the various chart types.When you rest the mouse pointer over any chart type, a ScreenTip displays its name.
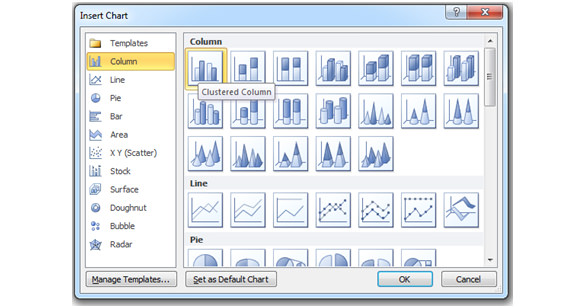
6. When you select a chart type, click ‘OK’. Selected chart will appear in the word file and an Excel sheet alongside the word file.
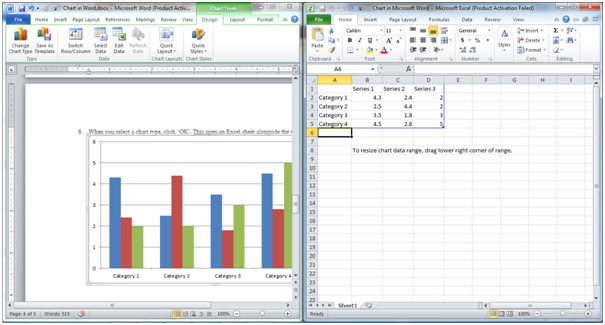
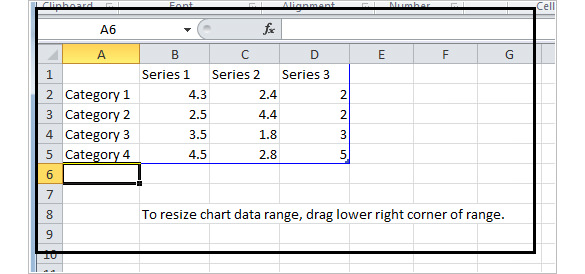
7. You can edit the data in the Excel window. The data will be automatically updated, incorporated and displayed in the chart inserted in the word file.
Experience Enhancing Tips
When user selects the inserted chart, new temporary options on Menu bar entitled ‘Chart Tools’. Chart Tools comprises of three groups; Design, Layout and Format.
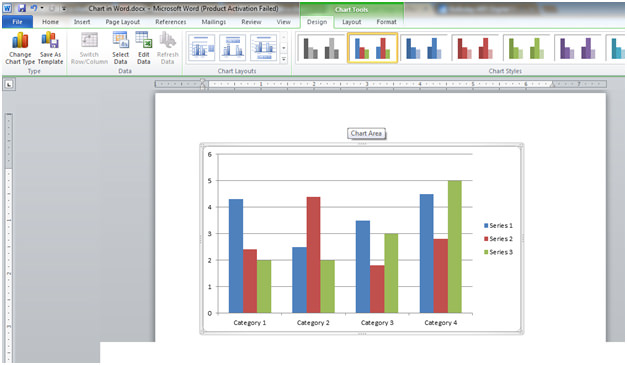
Available Chart Types
> Column Charts
Column charts are suitable for showing data changes over a period of time or for illustrating comparisons among items. Categories are normally organized along the horizontal axis and values along the vertical axis.
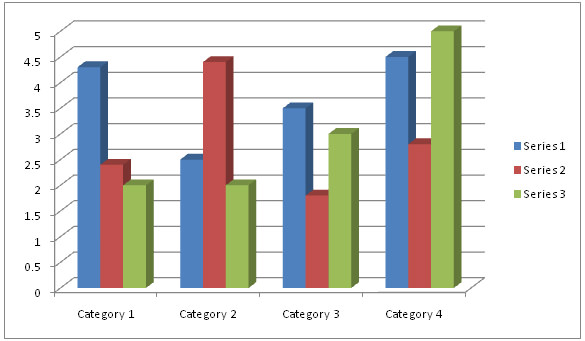
Column charts have the following categories:
- Clustered column and clustered column in 3-D
- Stacked column and stacked column in 3-D
- 100% stacked column and 100% stacked column in 3-D
- 3-D column
- Cylinder, cone, and pyramid
> Line Charts
Line charts are ideal for showing periodic trends in data as these display continuous data over time, set against a common scale. Category data is distributed evenly along the horizontal axis, while all value data is distributed evenly along the vertical axis.
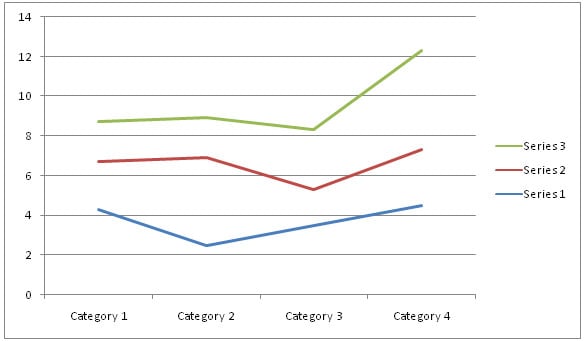
Line charts have the following categories:
- Line and line with markers
- Stacked line and stacked line with markers
- 100% stacked line and 100% stacked line with markers
- 3-D line
> Pie Charts
Pie charts show the size of items in one data series, relative to the sum of the items. The data points in a pie chart template are displayed as a percentage of the whole.
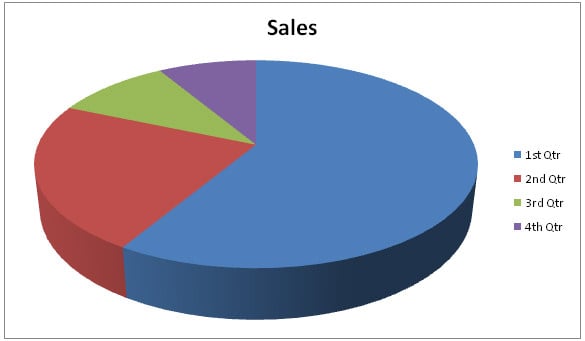
Pie charts have the following categories:
- Pie and pie in 3-D
- Pie of pie and bar of pie
- Exploded pie and exploded pie in 3-D
> Bar Charts
Bar charts show comparisons among individual items. A bar chart can be used when the axis labels are long and the values that are displayed are durations.
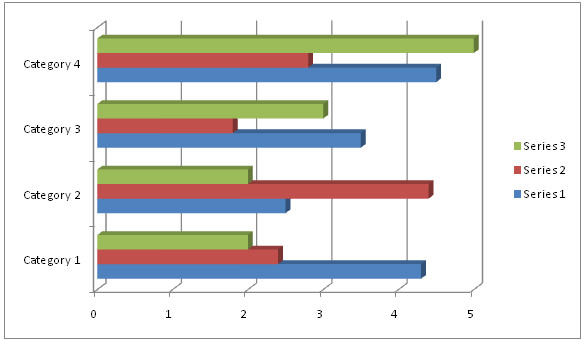
Bar charts have the following categories:
- Clustered bar and clustered bar in 3-D
- Stacked bar and stacked bar in 3-D
- 100% stacked bar and 100% stacked bar in 3-D
- Horizontal cylinder, cone, and pyramid
> Area Charts
Area charts highlight the scale of change over time. These can be used to highlight the total value across a trend. An area chart also displays the relationship of parts to a whole.
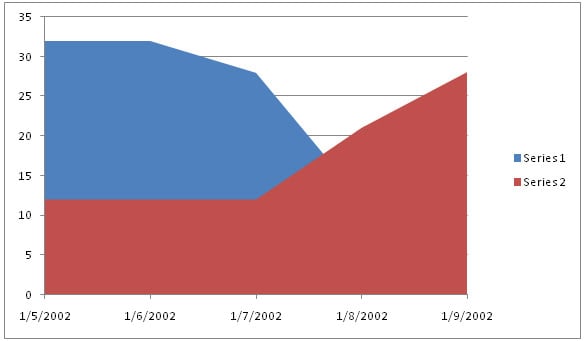
Area charts have the following categories:
- 2-D area and 3-D area:
- Stacked area and stacked area in 3-D
- 100% stacked area and 100% stacked area in 3-D
> XY (scatter) Charts
Scatter charts display the relationships among the numeric values in several data series, or plot two groups of numbers as one series of xy coordinates.Scatter charts are usually used for showing and comparing numeric values and data.To arrange data on a worksheet for a scatter chart, you should place the x values in one row or column, and then enter the corresponding y values in the adjacent rows or columns.
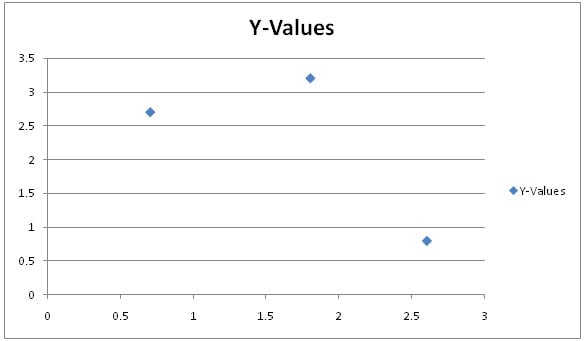
Scatter charts have the following categories:
- Scatter with only markers
- Scatter with smooth lines and scatter with smooth lines and markers
- Scatter with straight lines and scatter with straight lines and markers
> Stock Charts
A stock chart is most often used to show the fluctuation of stock prices. Moreover, this chart may also be used for scientific data. You must consolidate your data in the correct order to create stock charts.The way stock chart data is organized in the worksheet is very important.
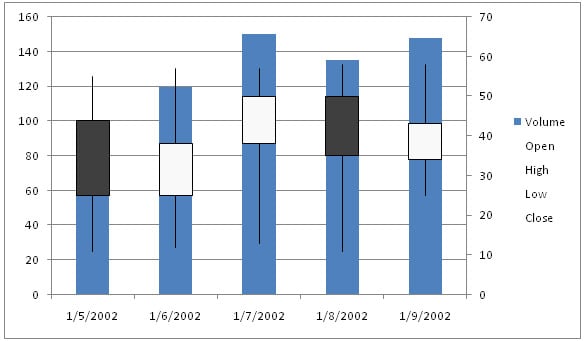
Stock charts have the following chart sub-types:
- High-low-close
- Open-high-low-close
- Volume-high-low-close
- Volume-open-high-low-close
> Surface Charts
A surface chart is used when you require finding optimum combinations between two sets of data. As in a topographic map, colors and patterns indicate areas that are in the same range of values.You can use a surface chart when both categories and data series are numeric values.
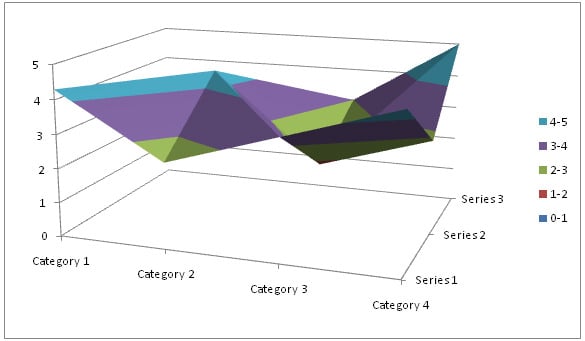
Surface charts have the following categories:
- 3-D surface
- Wireframe 3-D surface
- Contour
- Wireframe contour
> Doughnut Charts
Like a pie chart, a doughnut chart displays the proportions of parts to a whole; however, unlike pie chart, it can contain more than one data series.
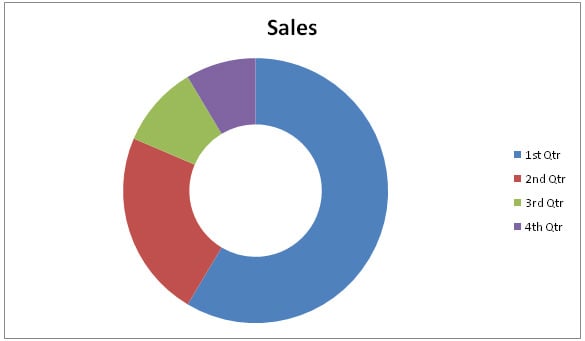
Doughnut charts have the following categories:
- Doughnut
- Exploded Doughnut
> Bubble Charts
Bubble charts are used when Data is organized so that x values are listed in the first column and corresponding y values and bubble size values are listed in adjacent columns can be plotted in a bubble chart template.For example, you would organize your data as shown in the following example.
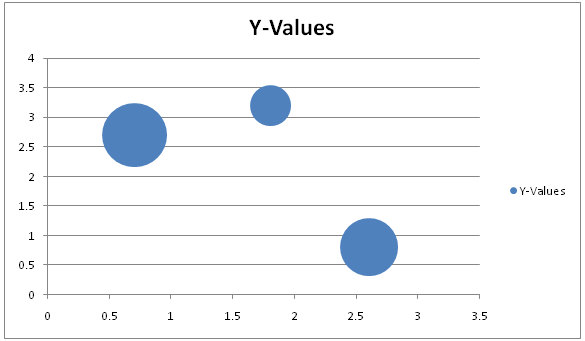
Bubble charts have the following categories:
- Bubble or bubble with 3-D effect
> Radar Charts
Radar charts compare the collective values of several data series.
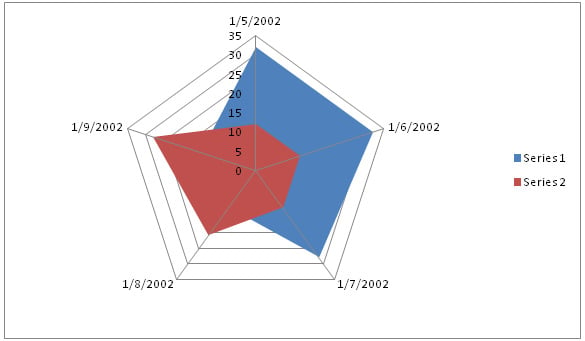
Radar charts have the following categories:
- Radar and radar with markers
- Filled radar


