
32+ Christmas Stationery Templates
Christmas is one of those most cherished occasions of the year when we love to send our holiday greetings to…
Dec 20, 2020


May 03, 2024
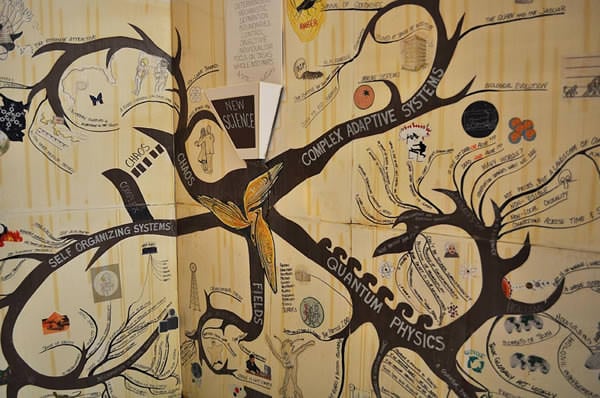
The first fishbone diagram was created in 1968 by Kaoru Ishikawa. And for the last 50+ years, the diagram has been used by so many different people to show the actual causes of events. Because of their popularity and usefulness, these diagrams have improved overtime, and now there are fishbone diagram templates that you can use for root cause analysis. You can also see heart diagram template. This Root cause analysis template has a number of variables, usually known as categories: machine, environment, measurements and people. This diagram can help you study relationships between or among variables. Further, the results obtained, after getting the exact cause of an event, will provide the best insight of the issue at hand.


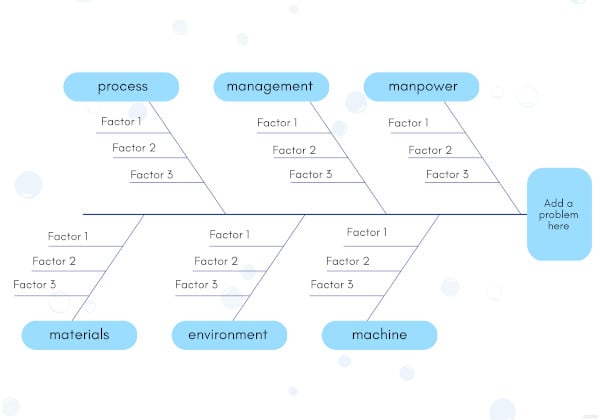
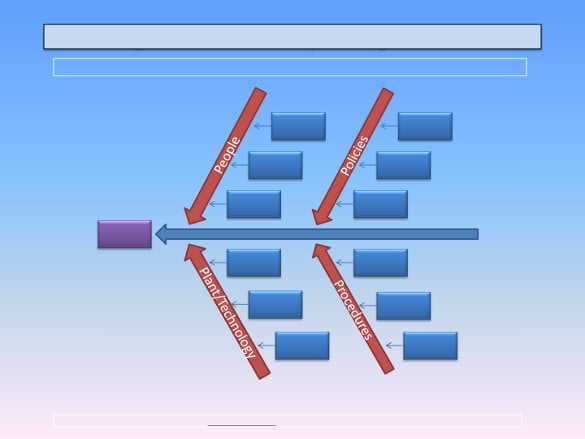
This is a visualization tool used for categorizing any potential cause of problems with the aim of identifying the root causes. Few important materials required for this diagram are whiteboard or flipchart and marking pens. The major categories for which this is used are machines, methods, materials, people, environment and measurements. Problem causing categories are mentioned on the main arrow of the fishbone diagram.


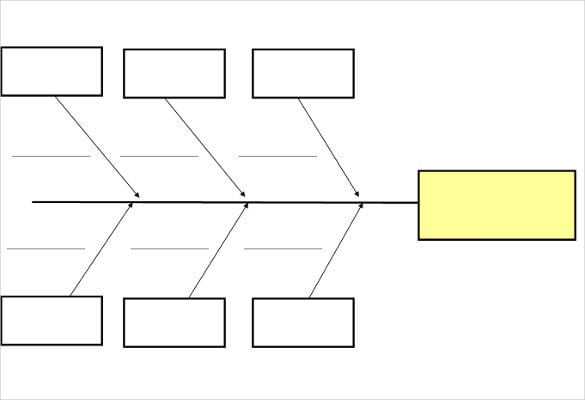
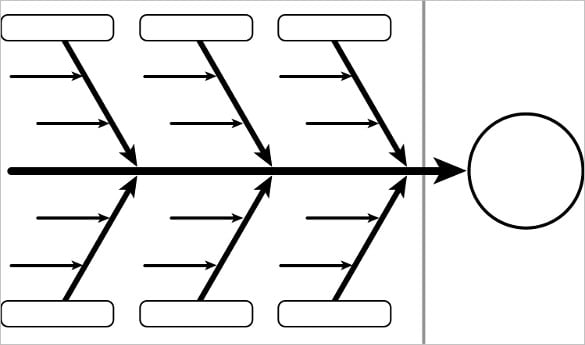
For showing in a diagrammed format any problem and resolution blank fishbone diagram template can be used. The tables, formats and blanks boxes are readily available to edit and adjust per the requirements. The center line is called as the main bone just like that of a fish. The circle at the end of the diagram is to represent the solution of the problem in question. View a wider selection of fish vector templates right here.

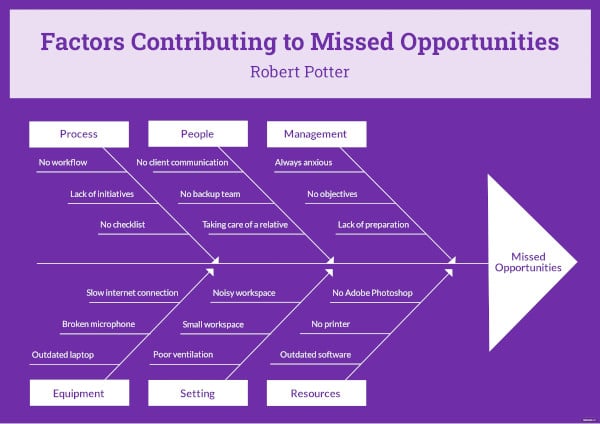
This is a simple graphic arrangement that exhibitions all the probable causes of problems. It is referred as the Ishakawa diagram. When this is used for market share representation the main categories are personnel, sales channel, advertisement, competitor and customer. It displays relationships logically and clearly and shows all causes simultaneously within one diagram. It also facilitates brainstorming and stimulates problem solution.

improhealth.org


http://siteresources.worldbank.org

is.muni.cz

uwaterloo.ca

asq.org

colinguthrie.com

www.exinfm.com

www.mass.gov
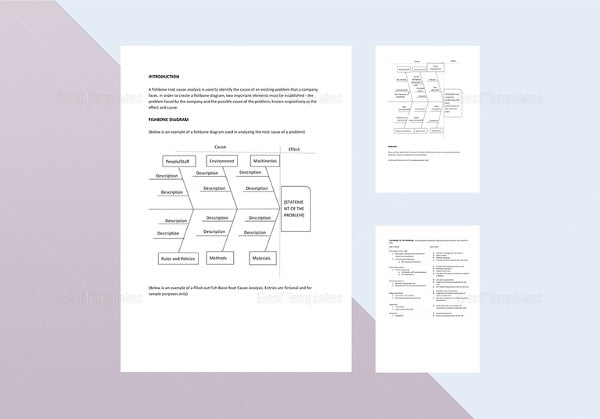
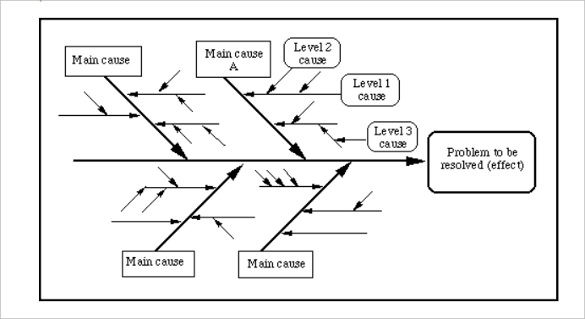
This tool is used to find the root-cause of any problem. It unlocks bottlenecks in any process and also identifies why a process is not working up to its expectation. Identifying possible issue causes and sketching it into the diagram will help in analyzing and brainstorming the issue and amongst the various alternative solutions available we can choose the best and most ideal one. Diagram should be able to clearly depict a problem and its solution(s). Find more sketch vector templates by visiting this link.
This method is very useful when you are trying to resolve complicated problems. Helps in noting brainstorming points and gives ample space and time to analyze and judge the best possible solution. It makes analysis simple and easier. It is an ideal method for group projects and assessments. If you have any DMCA issues on this post, please contact us!

Christmas is one of those most cherished occasions of the year when we love to send our holiday greetings to…

Thanksgiving is a time to reflect back on the good things that God has done for you in the year…
Brochures are concise and visually appealing forms of advertising or promotion for your company, brand, or business. They are completely…
There are different ways on how you can organize information. From school assignments to office presentations, most people are fond…

Anyone who spends his or her birthday always look forward to a unique and unforgettable birthday celebration. Most celebrants are…

A newspaper can be considered as one of the most important elements in our daily lives. Every morning as we…
Everyone has at least tried acquiring or purchasing a ticket once in their lives. Tickets are an essential document in…
Service ticket is a small form, which contains information for a certain service. This also serves as a proof to…
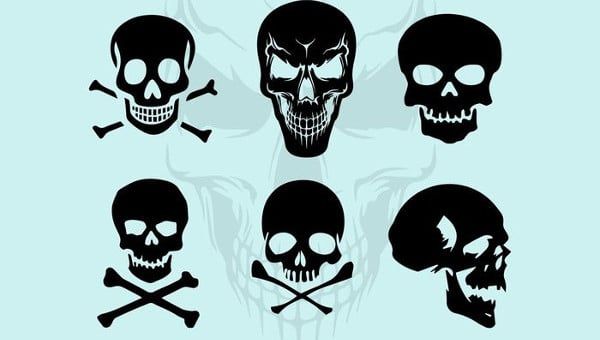
Skull art originated from the Aztecs before the Spanish colonization of Central America. The origin of the skull art started…