Free Top 20 U.S. States by Agricultural Production Value (2018-2025) Chart
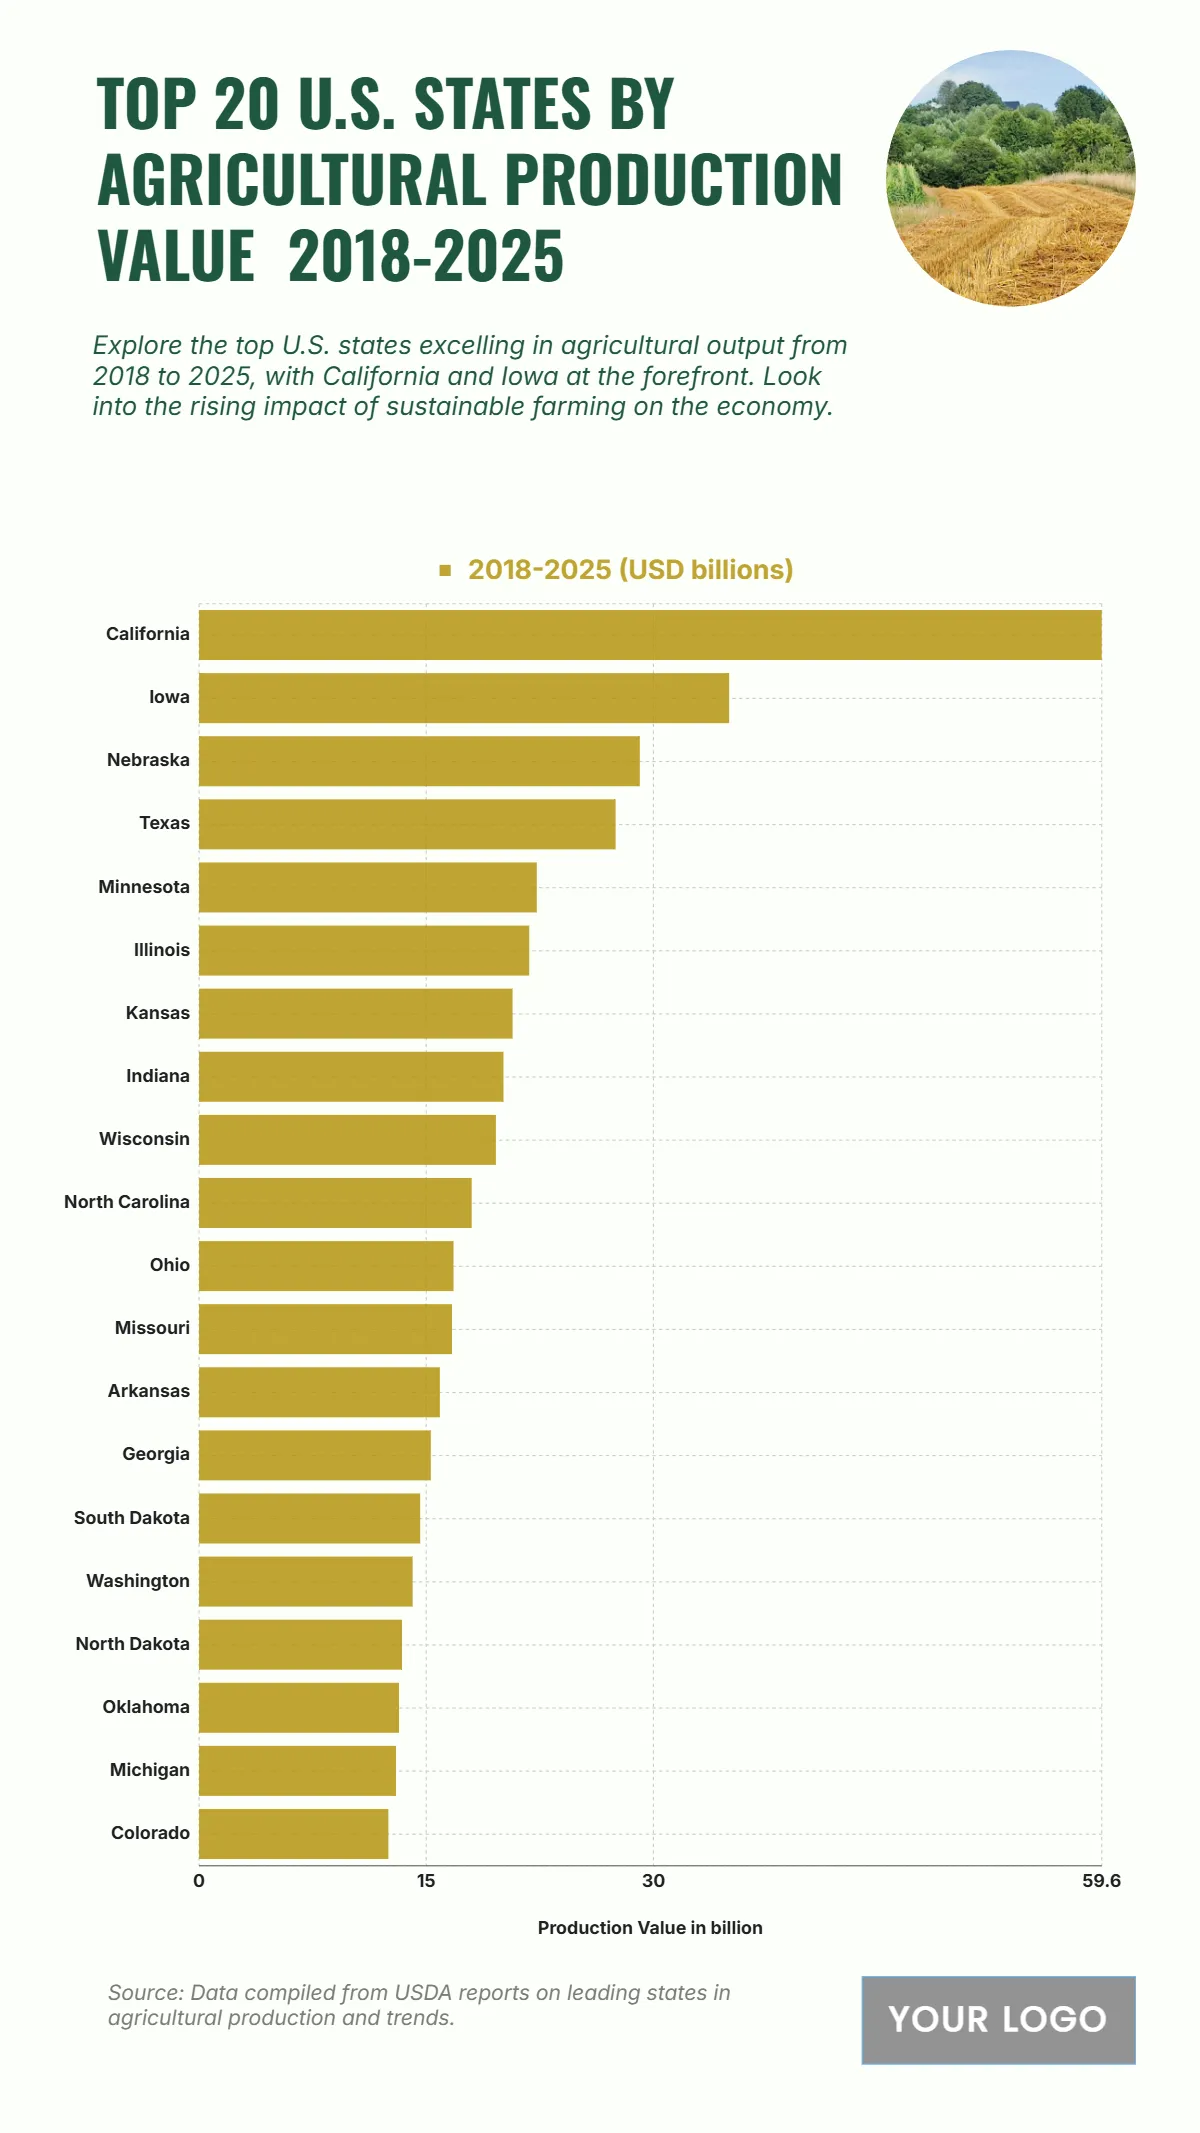
The chart titled “Top 20 U.S. States by Agricultural Production Value (2018–2025)” presents the leading contributors to the nation’s agricultural output over eight years. California dominates with production valued at approximately USD 59 billion, driven by its vast fruit, vegetable, and dairy sectors. Iowa ranks second with around USD 38 billion, reflecting its strong corn and soybean yields. Nebraska follows closely at about USD 33 billion, supported by livestock and grain production. Texas and Minnesota contribute roughly USD 30 billion and USD 28 billion, respectively, showcasing diverse agricultural bases. Illinois, Kansas, and Indiana each maintain values between USD 25 and 27 billion. Wisconsin, North Carolina, and Ohio also report steady growth near USD 23–24 billion. The remaining states, including Missouri, Georgia, and Washington, sustain moderate yet impactful contributions. Overall, the chart underscores California’s agricultural dominance and highlights the essential role of Midwestern and Southern states in sustaining national food production from 2018 to 2025.
| Labels |
2018–2025 (USD billions) |
| California | 59.6 |
| Iowa | 35 |
| Nebraska | 29.1 |
| Texas | 27.5 |
| Minnesota | 22.3 |
| Illinois | 21.8 |
| Kansas | 20.7 |
| Indiana | 20.1 |
| Wisconsin | 19.6 |
| North Carolina | 18 |
| Ohio | 16.8 |
| Missouri | 16.7 |
| Arkansas | 15.9 |
| Georgia | 15.3 |
| South Dakota | 14.6 |
| Washington | 14.1 |
| North Dakota | 13.4 |
| Oklahoma | 13.2 |
| Michigan | 13 |
| Colorado | 12.5 |


