Free Top 10 U.S. States by Total Domestic Investment (2020-2025) Chart
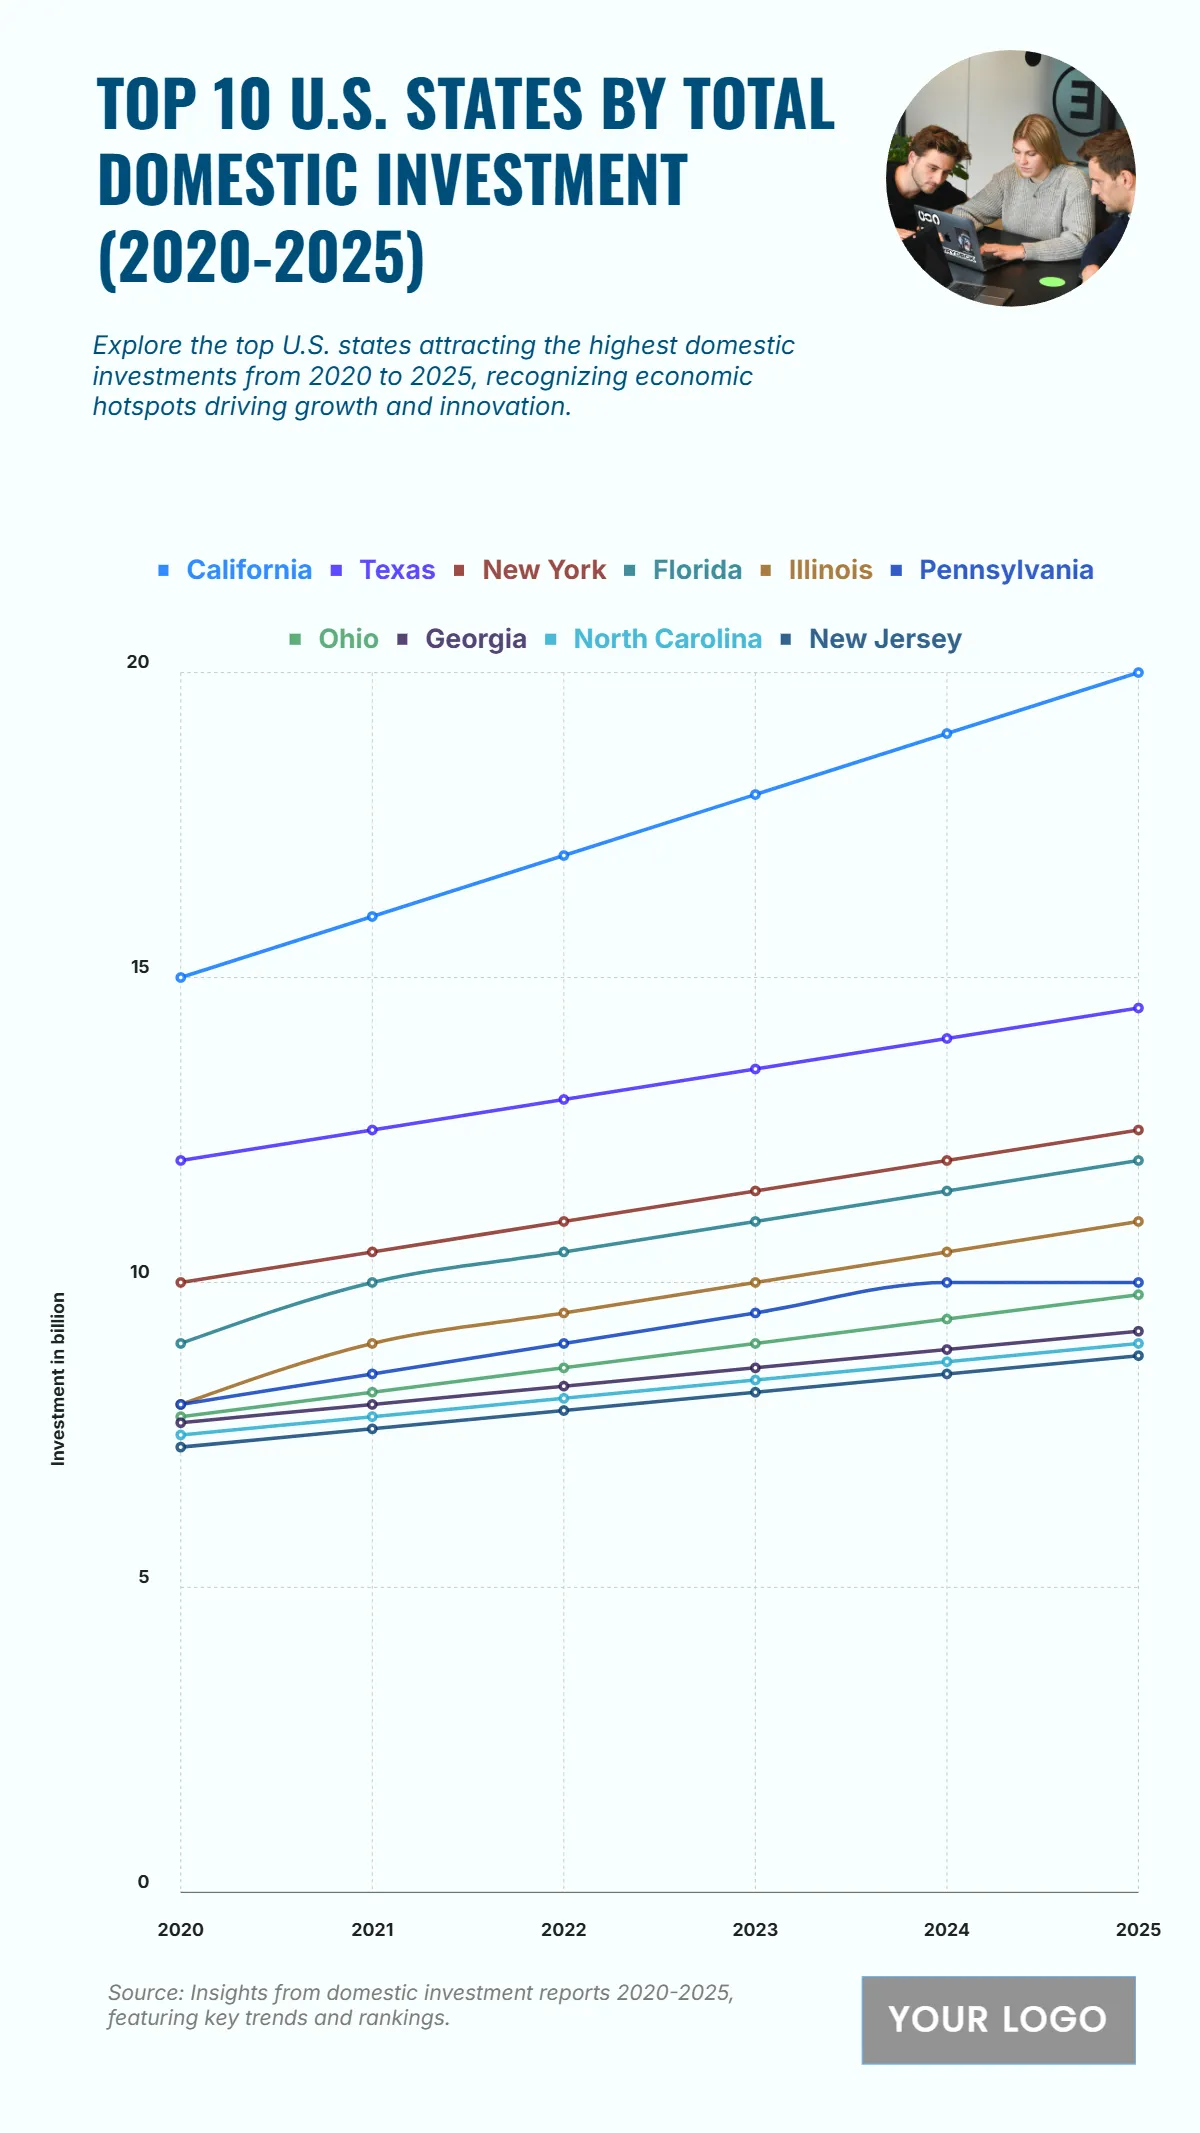
The chart titled “Top 10 U.S. States by Total Domestic Investment (2020–2025)” illustrates the states attracting the largest volumes of domestic investment during the five-year period. California leads with consistent growth, rising from about USD 15 billion in 2020 to nearly USD 20 billion by 2025, reflecting its strong technology, real estate, and green energy sectors. Texas follows with an increase from approximately USD 12 billion to USD 15 billion, driven by manufacturing and infrastructure expansion. New York maintains steady progress, reaching nearly USD 12 billion. Florida and Illinois show moderate gains between USD 9–11 billion, while Pennsylvania, Ohio, and Georgia report stable investment growth around USD 8–10 billion. North Carolina and New Jersey round out the top 10, reflecting incremental increases supported by business-friendly policies. Overall, the chart highlights sustained economic confidence, regional diversification, and expanding investment momentum across major U.S. states through 2025.
| Labels | 2020 | 2021 | 2022 | 2023 | 2024 | 2025 |
| California | 15 | 16 | 17 | 18 | 19 | 20 |
| Texas | 12 | 12.5 | 13 | 13.5 | 14 | 14.5 |
| New York | 10 | 10.5 | 11 | 11.5 | 12 | 12.5 |
| Florida | 9 | 10 | 10.5 | 11 | 11.5 | 12 |
| Illinois | 8 | 9 | 9.5 | 10 | 10.5 | 11 |
| Pennsylvania | 8 | 8.5 | 9 | 9.5 | 10 | 10 |
| Ohio | 7.8 | 8.2 | 8.6 | 9 | 9.4 | 9.8 |
| Georgia | 7.7 | 8 | 8.3 | 8.6 | 8.9 | 9.2 |
| North Carolina | 7.5 | 7.8 | 8.1 | 8.4 | 8.7 | 9 |
| New Jersey | 7.3 | 7.6 | 7.9 | 8.2 | 8.5 | 8.8 |


