Free Top 20 U.S. States by Highest Transportation Cost (2020-2025) Chart
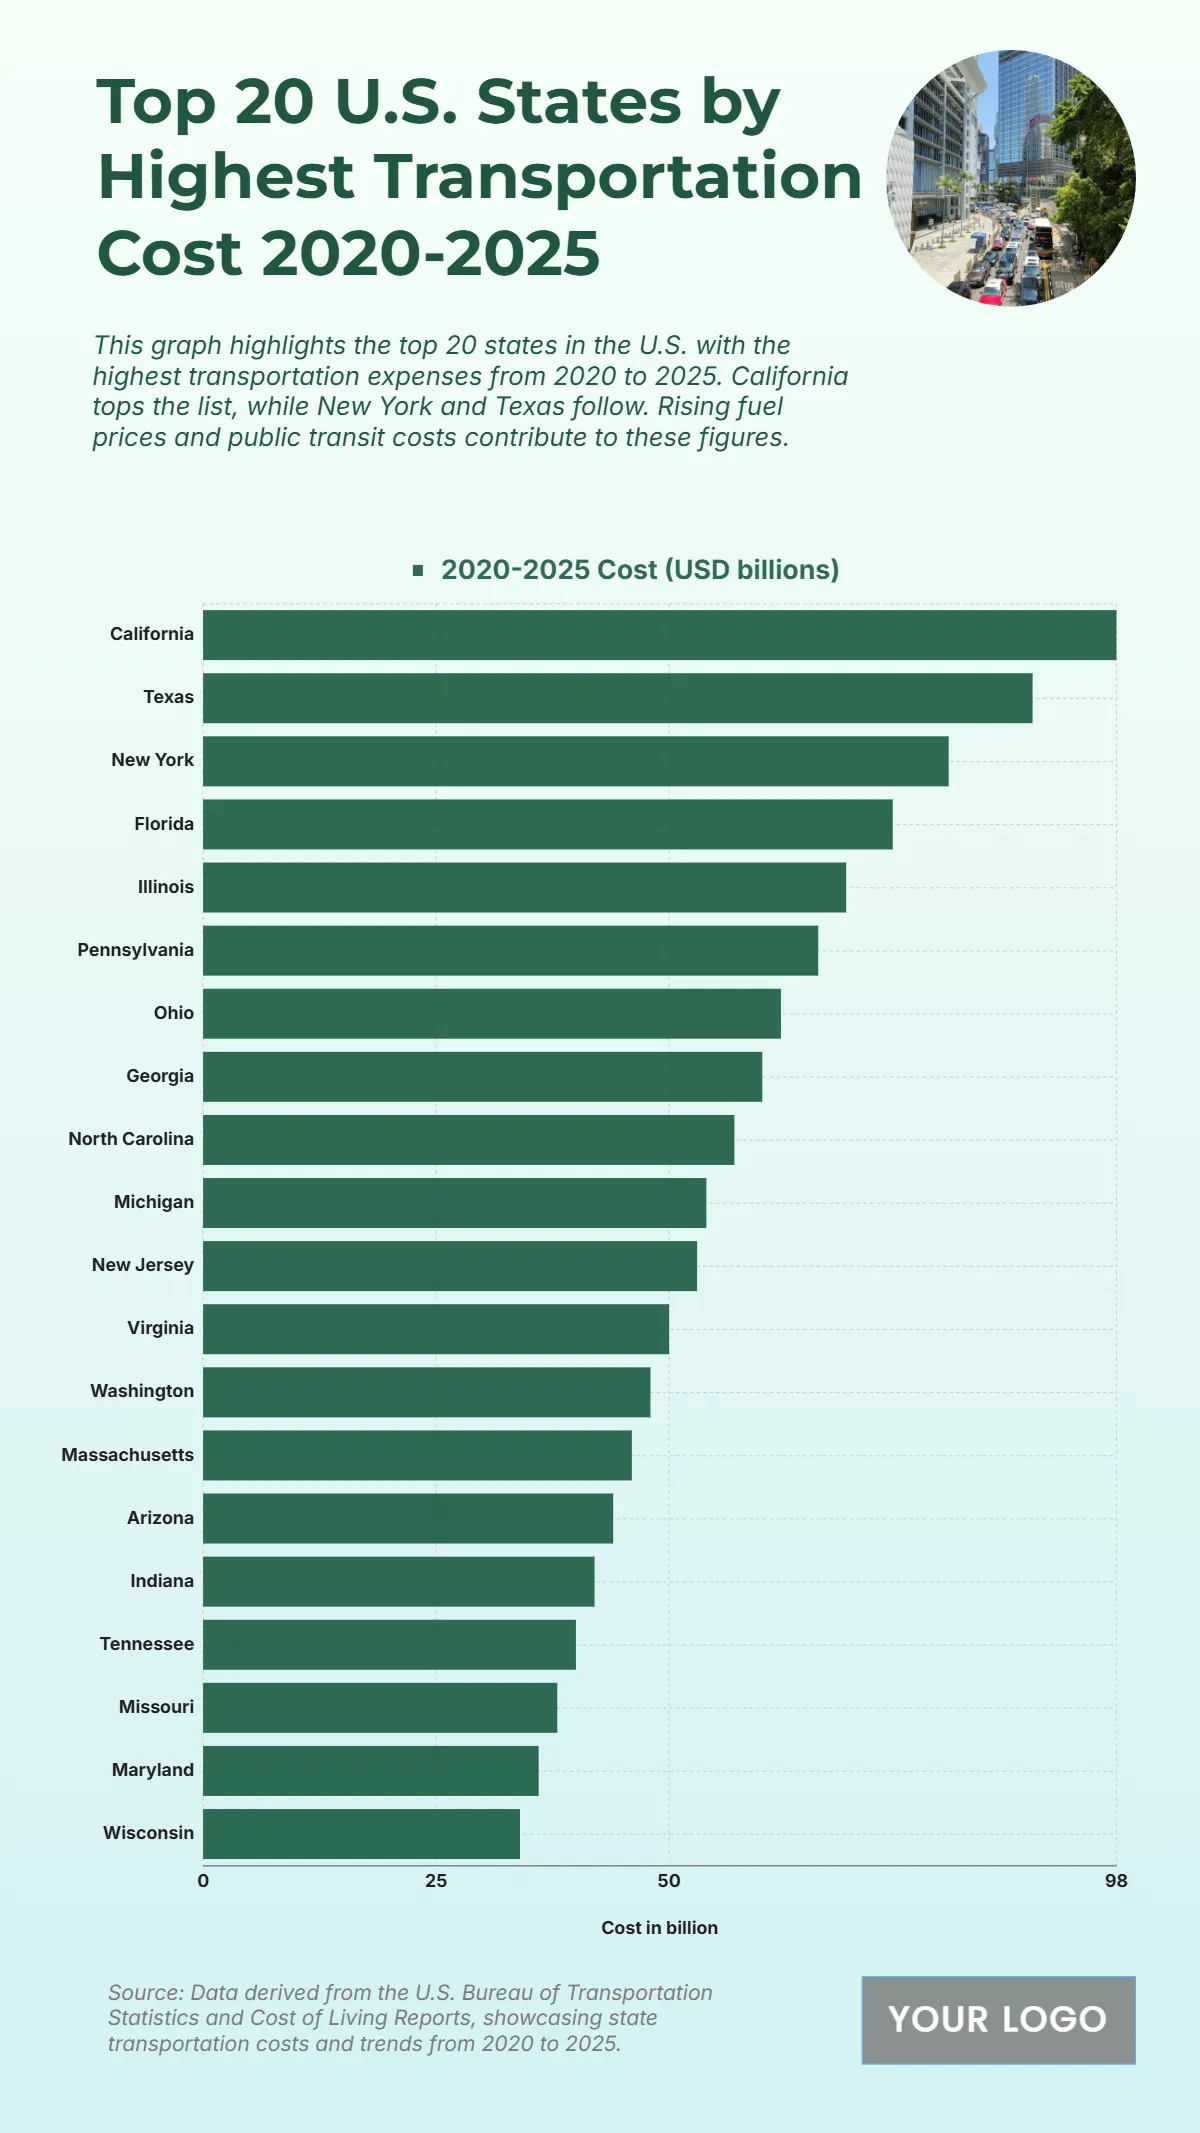
The chart highlights the top twenty U.S. states with the highest transportation costs from 2020 to 2025, illustrating how fuel prices, commuting distances, and infrastructure demands influence spending. California ranks first with total transportation costs exceeding $95 billion, driven by its vast urban networks, fuel expenses, and vehicle ownership rates. Texas follows closely at around $90 billion, reflecting extensive road usage and freight transportation activity. New York records about $80 billion, impacted by its dense urban transit systems and rising maintenance costs. Florida and Illinois post costs near $70 billion and $65 billion, respectively, due to heavy commuter traffic and tourism-related travel. States such as Pennsylvania, Ohio, and Georgia range between $55 and $60 billion, while North Carolina, Michigan, and New Jersey report similar figures. Overall, the chart emphasizes how population growth, infrastructure scale, and economic activity contribute to escalating transportation expenditures across major U.S. states.
| Labels |
2020-2025 Cost (USD billions) |
| California | 98 |
| Texas | 89 |
| New York | 80 |
| Florida | 74 |
| Illinois | 69 |
| Pennsylvania | 66 |
| Ohio | 62 |
| Georgia | 60 |
| North Carolina | 57 |
| Michigan | 54 |
| New Jersey | 53 |
| Virginia | 50 |
| Washington | 48 |
| Massachusetts | 46 |
| Arizona | 44 |
| Indiana | 42 |
| Tennessee | 40 |
| Missouri | 38 |
| Maryland | 36 |
| Wisconsin | 34 |


