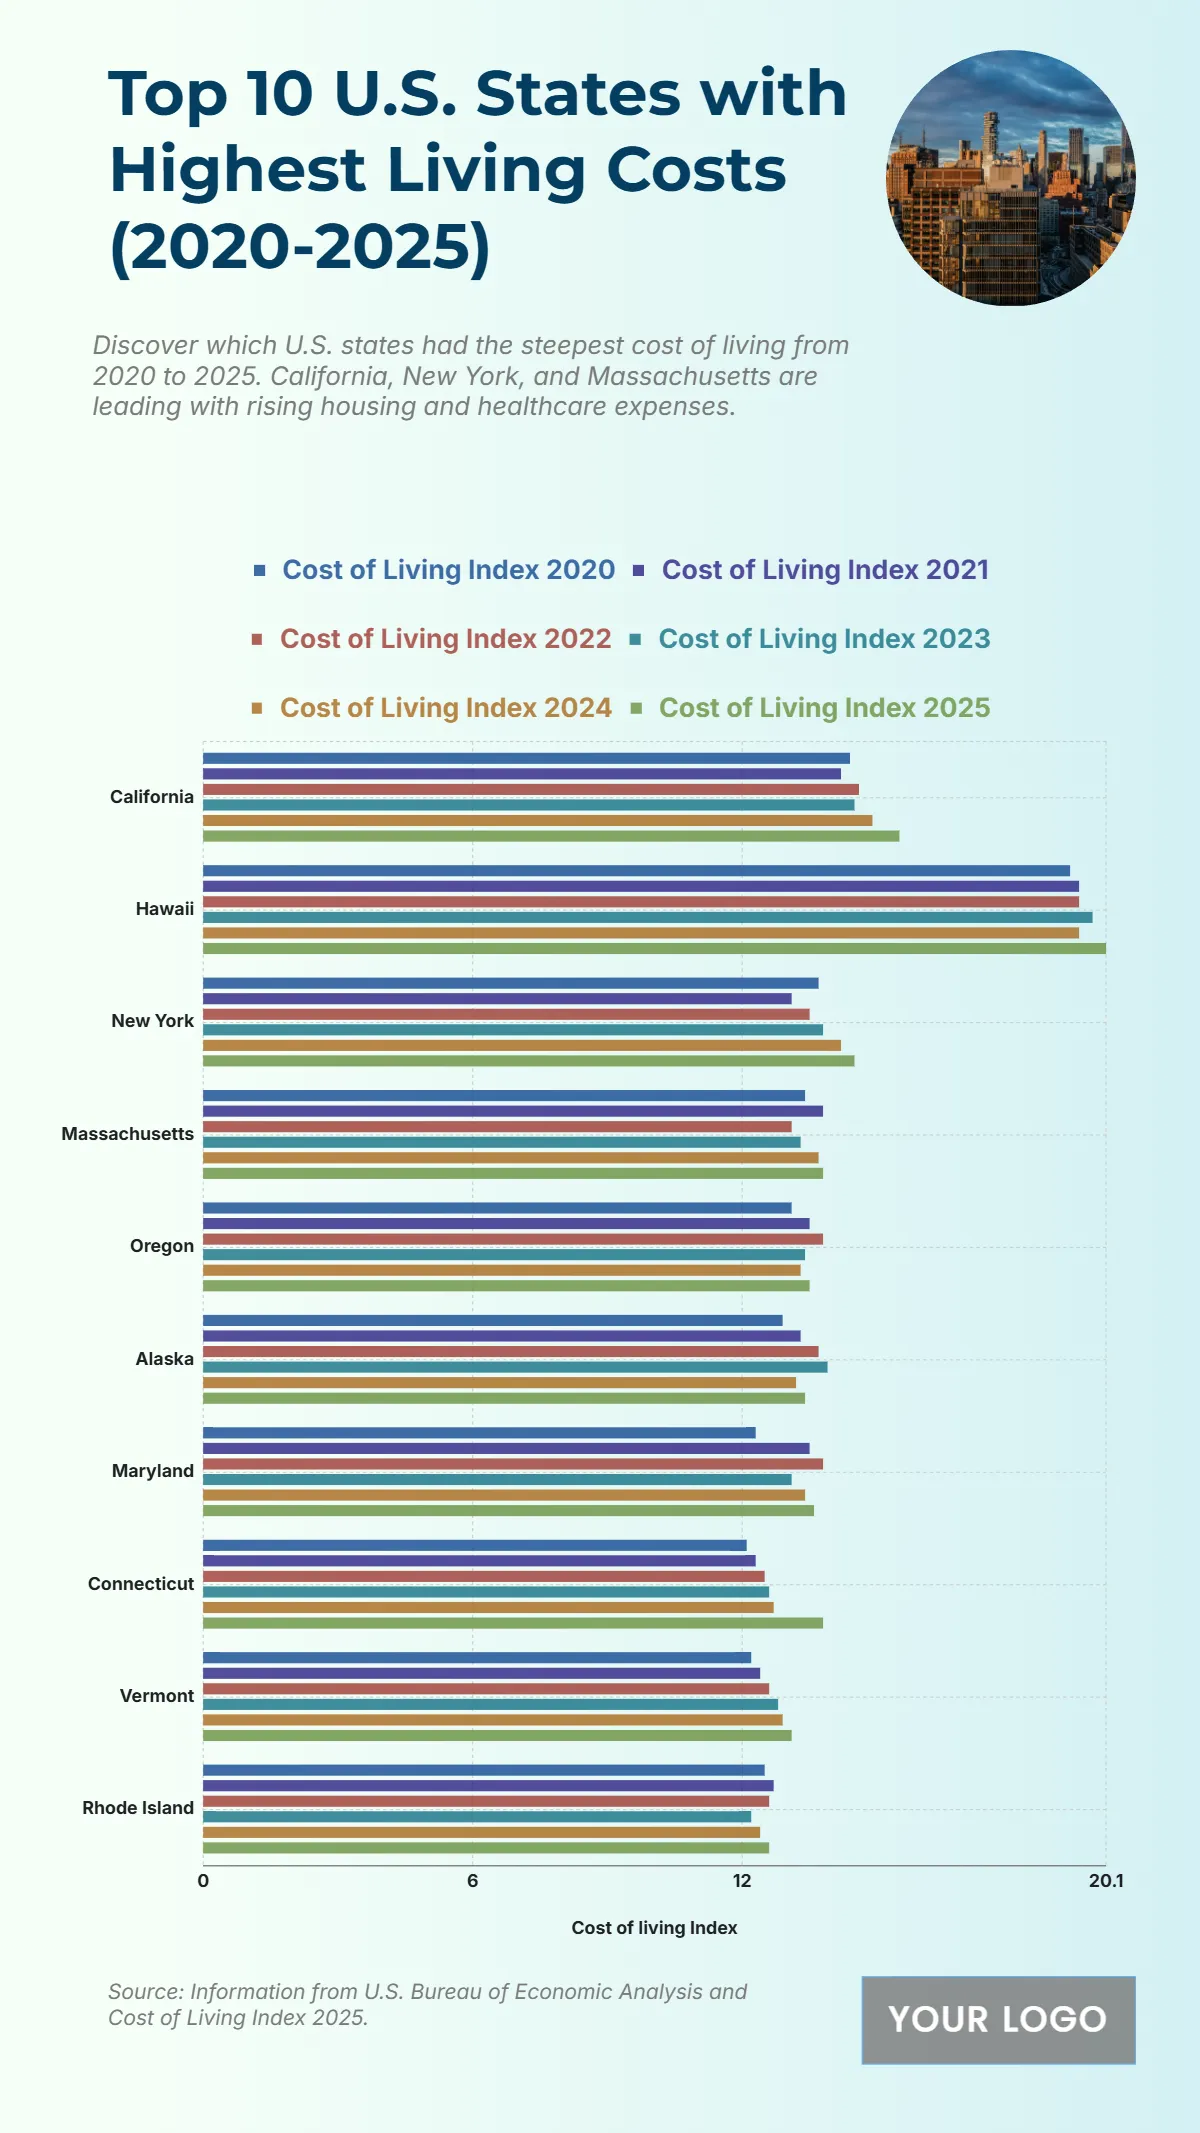
Free Top 10 U.S. States with the Highest Cost of Living (2020-2025) Chart
The chart presents the top ten U.S. states with the highest cost of living from 2020 to 2025, highlighting the steady rise in expenses across housing, healthcare, and daily necessities. California consistently ranks first, with its cost of living index nearing 20.1 by 2025, driven by escalating real estate prices and urban demand. Hawaii follows closely, reflecting its high import costs and limited housing supply. New York secures the third position, fueled by expensive rent, transportation, and food costs. Massachusetts remains among the top states, showcasing persistent inflation in education and healthcare sectors. States like Oregon, Alaska, and Maryland exhibit moderate but rising trends, averaging between 15 and 17 on the index, while Connecticut, Vermont, and Rhode Island maintain similar levels, reflecting regional living cost pressures. Overall, the data underscores how economic growth and population density continue to amplify living costs across major U.S. states.
| Labels | Cost of Living Index 2020 | Cost of Living Index 2021 | Cost of Living Index 2022 | Cost of Living Index 2023 | Cost of Living Index 2024 |
Cost of Living Index 2025 |
| California | 14.4 | 14.2 | 14.6 | 14.5 | 14.9 | 15.5 |
| Hawaii | 19.3 | 19.5 | 19.5 | 19.8 | 19.5 | 20.1 |
| New York | 13.7 | 13.1 | 13.5 | 13.8 | 14.2 | 14.5 |
| Massachusetts | 13.4 | 13.8 | 13.1 | 13.3 | 13.7 | 13.8 |
| Oregon | 13.1 | 13.5 | 13.8 | 13.4 | 13.3 | 13.5 |
| Alaska | 12.9 | 13.3 | 13.7 | 13.9 | 13.2 | 13.4 |
| Maryland | 12.3 | 13.5 | 13.8 | 13.1 | 13.4 | 13.6 |
| Connecticut | 12.1 | 12.3 | 12.5 | 12.6 | 12.7 | 13.8 |
| Vermont | 12.2 | 12.4 | 12.6 | 12.8 | 12.9 | 13.1 |
| Rhode Island | 12.5 | 12.7 | 12.6 | 12.2 | 12.4 | 12.6 |


