Free Top 10 U.S. States by Personal Loan Growth (2018-2025) Chart
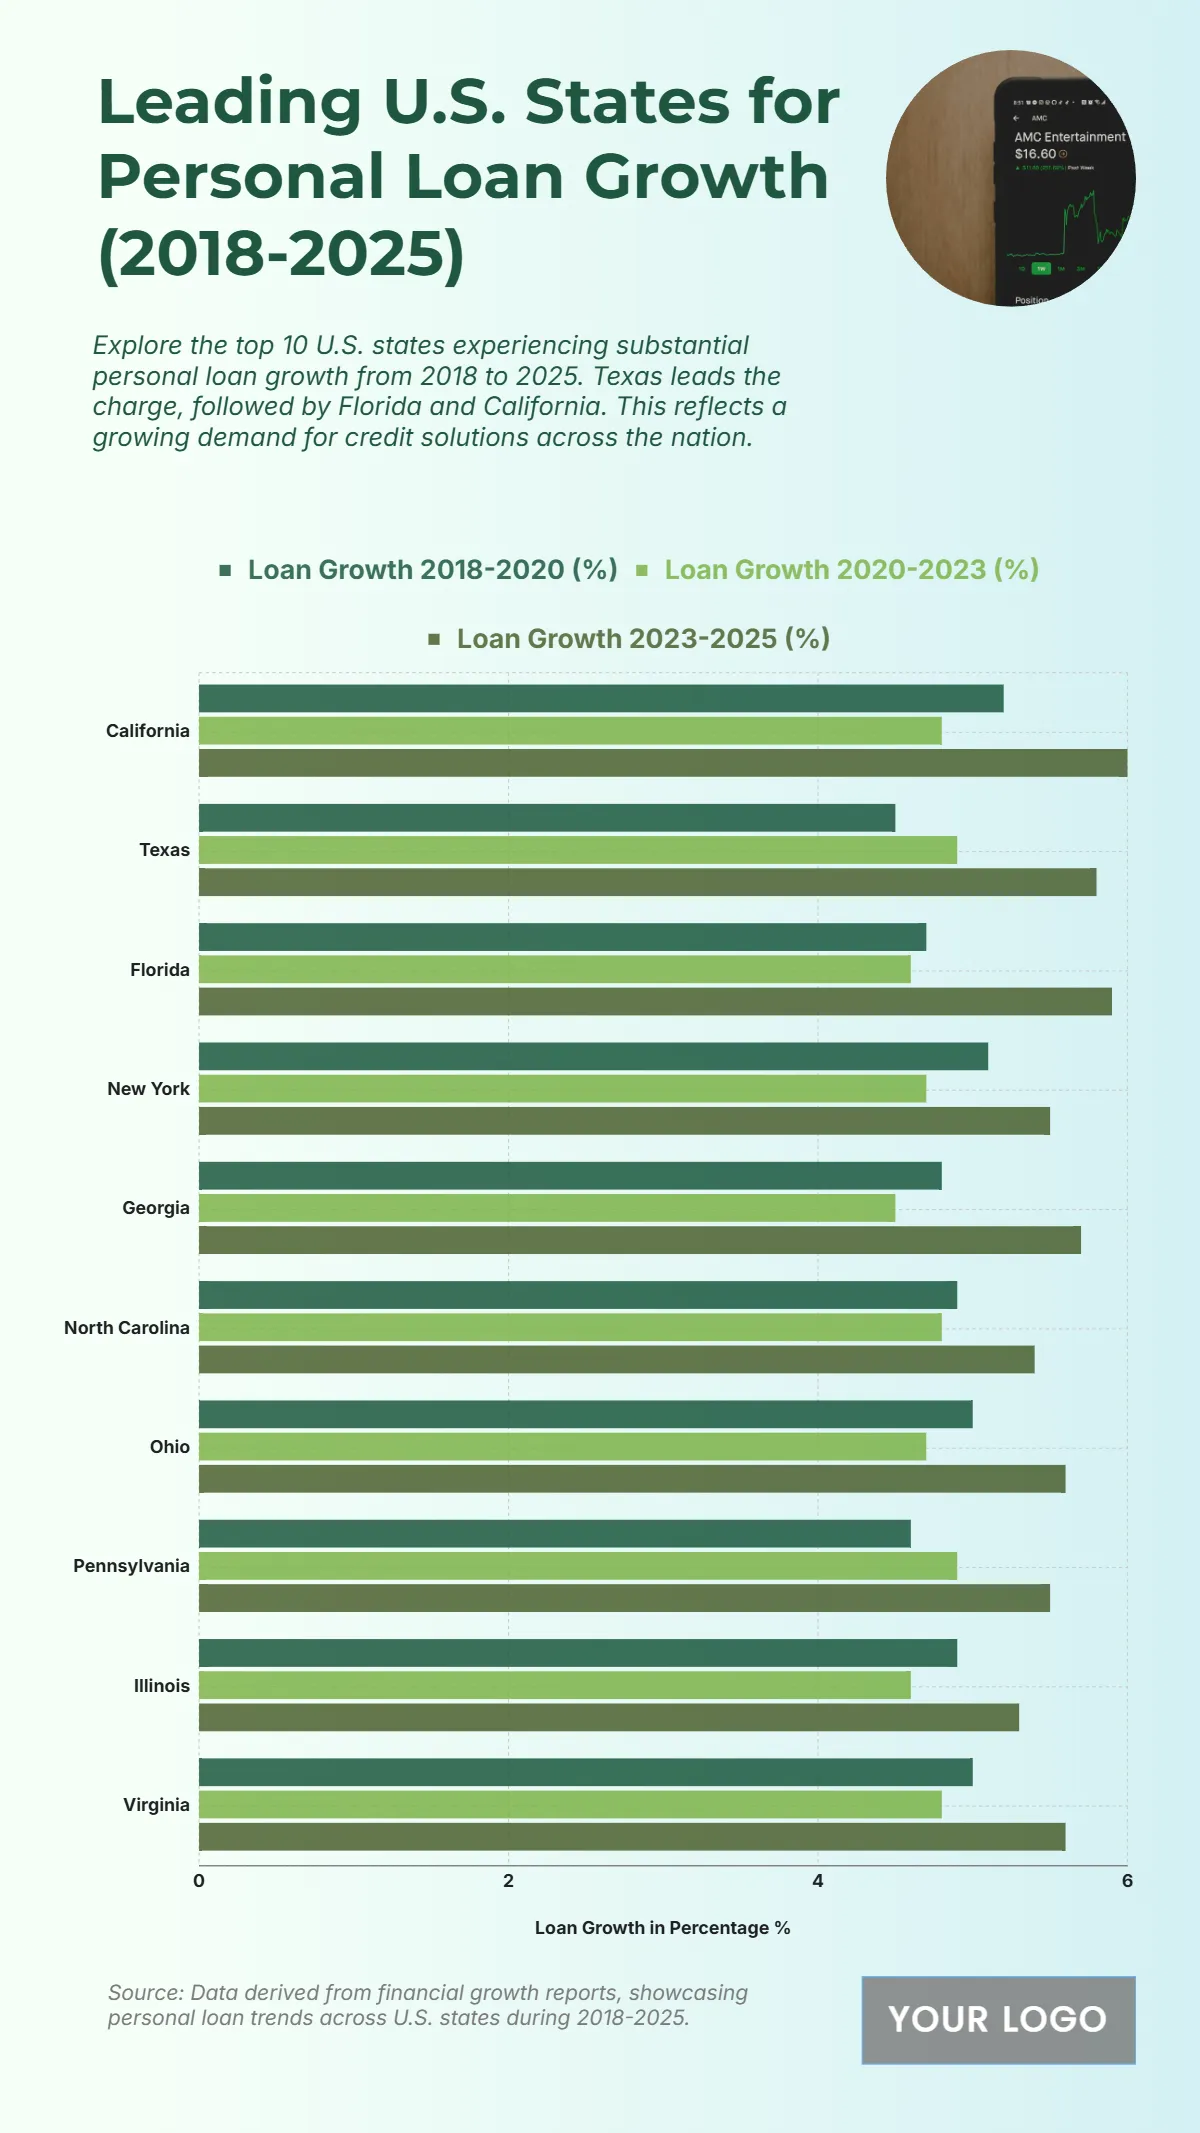
The chart highlights the leading U.S. states for personal loan growth between 2018 and 2025, reflecting increasing credit activity and consumer borrowing trends. Texas tops the list with a projected loan growth rate of about 6% by 2025, driven by expanding financial access and population growth. Florida and California follow closely at around 5.8% and 5.6%, boosted by rising household spending and digital lending platforms. New York and Georgia maintain steady growth near 5.5%, underscoring strong demand for flexible credit options. States such as North Carolina, Ohio, and Pennsylvania show moderate increases of 4.8% to 5.2%, signaling balanced lending markets. Meanwhile, Illinois and Virginia record stable growth patterns near 4.5%, consistent with national averages. Overall, the data demonstrates expanding consumer confidence and sustained demand for personal loans across diverse U.S. economies from 2018 to 2025.
| Labels | Loan Growth 2018-2020 (%) | Loan Growth 2020-2023 (%) |
Loan Growth 2023-2025 (%) |
| California | 5.2 | 4.8 | 6 |
| Texas | 4.5 | 4.9 | 5.8 |
| Florida | 4.7 | 4.6 | 5.9 |
| New York | 5.1 | 4.7 | 5.5 |
| Georgia | 4.8 | 4.5 | 5.7 |
| North Carolina | 4.9 | 4.8 | 5.4 |
| Ohio | 5 | 4.7 | 5.6 |
| Pennsylvania | 4.6 | 4.9 | 5.5 |
| Illinois | 4.9 | 4.6 | 5.3 |
| Virginia | 5 | 4.8 | 5.6 |


