Get Access to World’s largest Template Library & Tools

How to Create a Frequency Distribution in Microsoft Excel


Microsoft Excel enables you to create a frequency distribution, a crucial technique for summarizing and visualizing data understandably. Ideal for professional and educational environments, this skill facilitates the analysis of data ranges and patterns, ensuring you can draw meaningful conclusions from your datasets with ease.
How to Create a Frequency Distribution in Microsoft Excel


Creating a frequency distribution in Microsoft Excel allows you to analyze data sets by summarizing values into categories or intervals. Follow these few steps to do it successfully.

  • Step 1. Prepare Your Data

    Start by organizing your data in a single column to simplify the process of creating a frequency distribution. Ensure that all the data you plan to analyze is clean, meaning there are no blank cells or non-numeric values mixed in if you are focusing on numerical data.

  • Step 2. Define Bins for Your Distribution
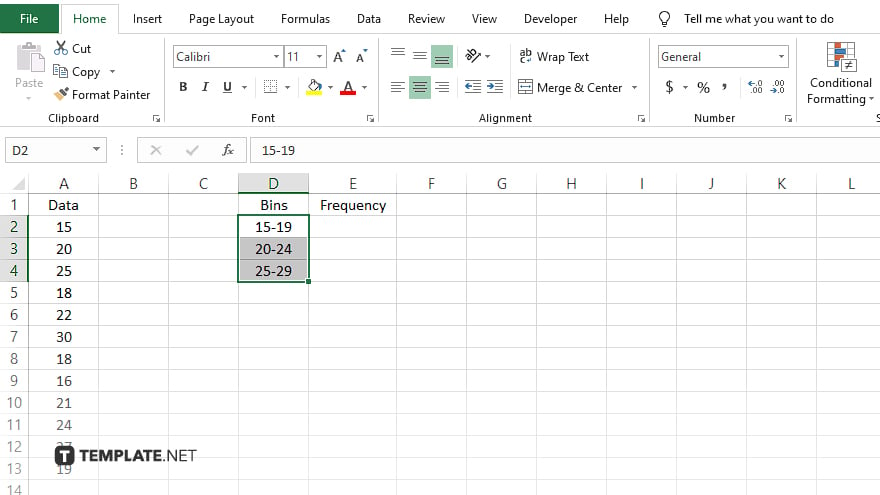
    step 2 define bins for your distribution

    Bins are intervals or categories used to group your data points. In a separate column, list down the upper limits for each bin you want to create. Make sure these bins cover the range of your data without any gaps.

  • Step 3. Use the Frequency Function

    step 3 use the frequency function

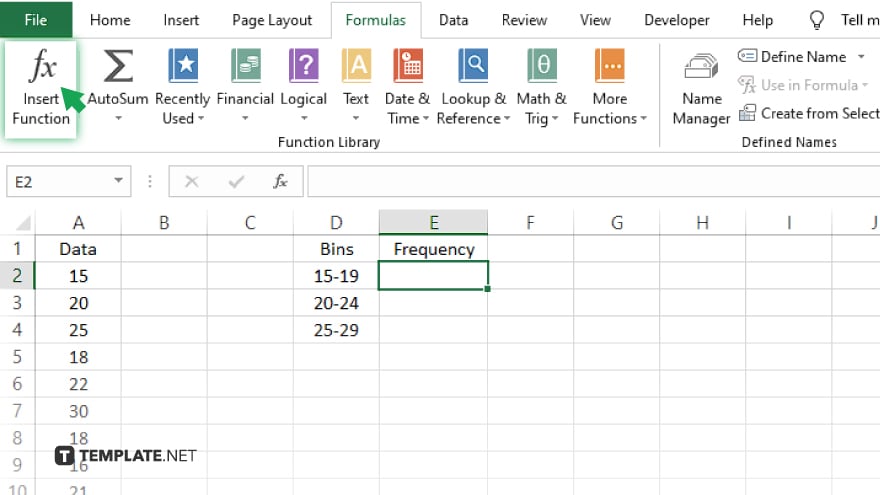
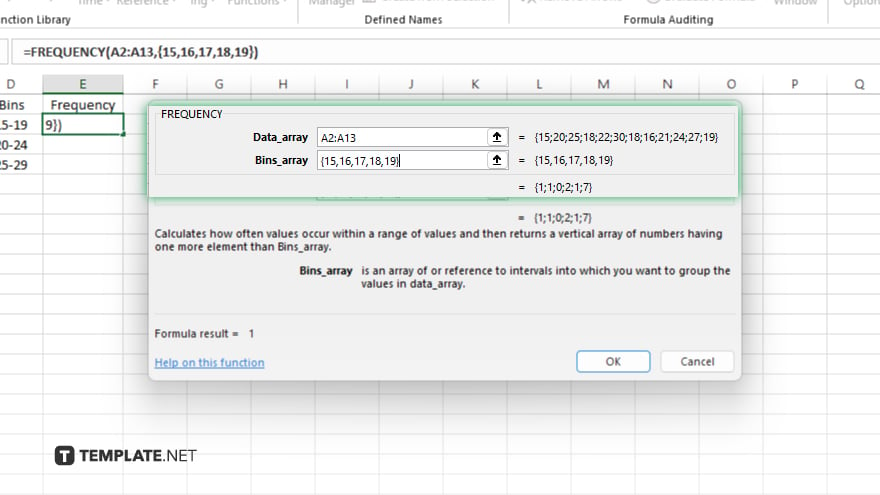
    Select an empty cell where you want your frequency distribution to begin. Then, go to the Formulas tab, click “Insert Function,” and find the “FREQUENCY” function. Excel will prompt you to enter two ranges: the data array (your data) and the bins array (your bins’ upper limits).

  • Step 4. Enter Array Formula

    step 4 enter array formula

    After entering the data and bins arrays in the function dialog, finalize the formula as an array formula. Do this by pressing Ctrl+Shift+Enter instead of just Enter. Excel will automatically fill in the frequencies for each bin you’ve defined.

  • Step 5. Create a Histogram (Optional)

    To visually represent your frequency distribution, you can easily make a histogram in Microsoft Excel. Go to the Insert tab, choose “Charts,” then select “Histogram.” Use your frequency distribution data as the source for the chart.

You may also find valuable insights in the following articles offering tips for Microsoft Excel:

note iconNote

Unlock Your Productivity with Over 100,000 Microsoft Excel Templates! Exclusively Available at Template.net – Download Now and Transform Your Data Handling Experience!

FAQs

What are “bins” in a frequency distribution in Excel?

Bins are categories or intervals used to group similar values in a frequency distribution.

Can I use non-numeric data to create a frequency distribution in Excel?

Yes, non-numeric data can be categorized for frequency distributions, but numeric bins are not applicable.

How do I choose the right bin size for my frequency distribution in Excel?

Choose bin sizes that meaningfully group your data, considering the range and variability of your data set.

Is it possible to automatically generate bins in Excel for a frequency distribution?

Yes, Excel’s “Analysis ToolPak” add-in offers options to automatically create bins based on your data.

Can I create a frequency distribution chart in Excel?

Yes, you can create a histogram chart in Excel to visually represent your frequency distribution.

More in Excel

How to Calculate Columns in Microsoft ExcelHow to Change a Formula to a Value in Microsoft Excel
How to Flip Rows and Columns in Microsoft ExcelHow to Make a Box in Microsoft Excel
How to Use NPV in Microsoft ExcelHow to Make a List of Numbers in Microsoft Excel
How to Make a Sensitivity Table in Microsoft ExcelHow to Keep 0 in Front of a Number in Microsoft Excel
How to Do an Absolute Reference in Microsoft ExcelHow to Put a Drop Down in Microsoft Excel
How to Change a Negative Number to Positive in ExcelHow to Combine Tables in Microsoft Excel
How to Highlight Blank Cells in Microsoft ExcelHow to Save a Macro in Microsoft Excel
How to Sort by Month in Microsoft ExcelHow to Do a Percentage Increase in Microsoft Excel
How to Apply Filter in Microsoft ExcelHow to Delete Multiple Sheets in Microsoft Excel
How to Create a Slicer in Microsoft ExcelHow to Turn Microsoft Excel Data Into a Graph
How to Move a Page Break in Microsoft ExcelHow to Clear Table Format in Microsoft Excel
How to Extract the Year From a Date in Microsoft ExcelHow to Do a Bar Graph in Microsoft Excel
How to Change Theme in Microsoft ExcelHow to Calculate Cells in Microsoft Excel
How to Label X and Y Axis on Microsoft ExcelHow to Change Print Area in Microsoft Excel
How to Add 2 Cells in Microsoft ExcelHow to Write Vertically in Microsoft Excel
How to Display All Formulas in Microsoft ExcelHow to Change the Chart Style in Microsoft Excel
How to Enter Bullet Points in Microsoft ExcelHow to Change a Microsoft Excel File from Read Only
How to Show the Ribbon in Microsoft ExcelHow to Make a Clustered Column Chart in Excel
How to See Duplicates in Microsoft ExcelHow to Trim in Microsoft Excel
How to Do a Scatter Plot in Microsoft ExcelHow to Switch Cells in Microsoft Excel
How to Calculate Workdays in Microsoft ExcelHow to Make a Macro in Microsoft Excel
How to Create a Sensitivity Table in Microsoft ExcelHow to Calculate a Percentage in Microsoft Excel
How to Freeze 2 Rows in Microsoft ExcelHow to Import a File Into Microsoft Excel
How to Email a Microsoft Excel SheetHow to Create Labels in Word From Microsoft Excel
How to Auto-Adjust Row Height in Microsoft ExcelHow to Combine Tabs in Microsoft Excel
How to Wrap Text in a Microsoft Excel CellHow to Autofill the Date in Microsoft Excel
How to Fix a Circular Reference in Microsoft ExcelHow to Add a Label to an Axis in Microsoft Excel
How to Select a Row in Microsoft ExcelHow to Lock Cells in Microsoft Excel for Scrolling
How to Get Microsoft Excel to Round UpHow to Start a New Paragraph in Microsoft Excel
How to Insert Check Boxes in Microsoft ExcelHow to Change Horizontal Axis Values in Microsoft Excel
How to Enable the Developer Tab in Microsoft ExcelHow to Copy a Row in Microsoft Excel
How to Delete Extra Pages in Microsoft ExcelHow to Change a CSV File to Microsoft Excel
How to Share and Edit Microsoft Excel FilesHow to Find a P-Value in Microsoft Excel
How to Compare Two Microsoft Excel Sheets for DuplicatesHow to Delete a Chart in Microsoft Excel
How to Put Dates in Order on Microsoft ExcelHow to Freeze Both Rows and Columns in Microsoft Excel
How to Recover a Corrupted Microsoft Excel FileHow to Save a Microsoft Excel File as a CSV
How to Unprotect a Microsoft Excel SpreadsheetHow to Add Rows in Microsoft Excel Using a Shortcut
How to Do a Count in Microsoft ExcelHow to Find the Sum of a Column in Microsoft Excel
How to Make a Note in Microsoft ExcelHow to Find the Slope on a Microsoft Excel Graph
How to Remove #DIV/0 in Microsoft ExcelHow to Insert Symbols in Microsoft Excel
How to Budget With Microsoft ExcelHow to Reorder Rows in Microsoft Excel
How to Calculate the Total in Microsoft ExcelHow to Search a Microsoft Excel Document
How to Autofit Cells in Microsoft ExcelHow to Get the Total in Microsoft Excel
How to Get Rid of Dashed Lines in ExcelHow to Find the P-Value in Microsoft Excel
How to Sort by Alphabetical Order in Microsoft ExcelHow to Make Sequential Numbers in Microsoft Excel
How to Add Boxes in Microsoft ExcelHow to Graph Using Microsoft Excel
How to Change the Default Font in Microsoft ExcelHow to Add Today's Date in Microsoft Excel
How to Move Rows Up in Microsoft ExcelHow to Delete a Tab in Microsoft Excel
How to Freeze the First Two Rows in Microsoft ExcelHow to Separate Words in Excel Using a Formula
How to Rename a Microsoft Excel FileHow to Budget on Microsoft Excel
bottom banner