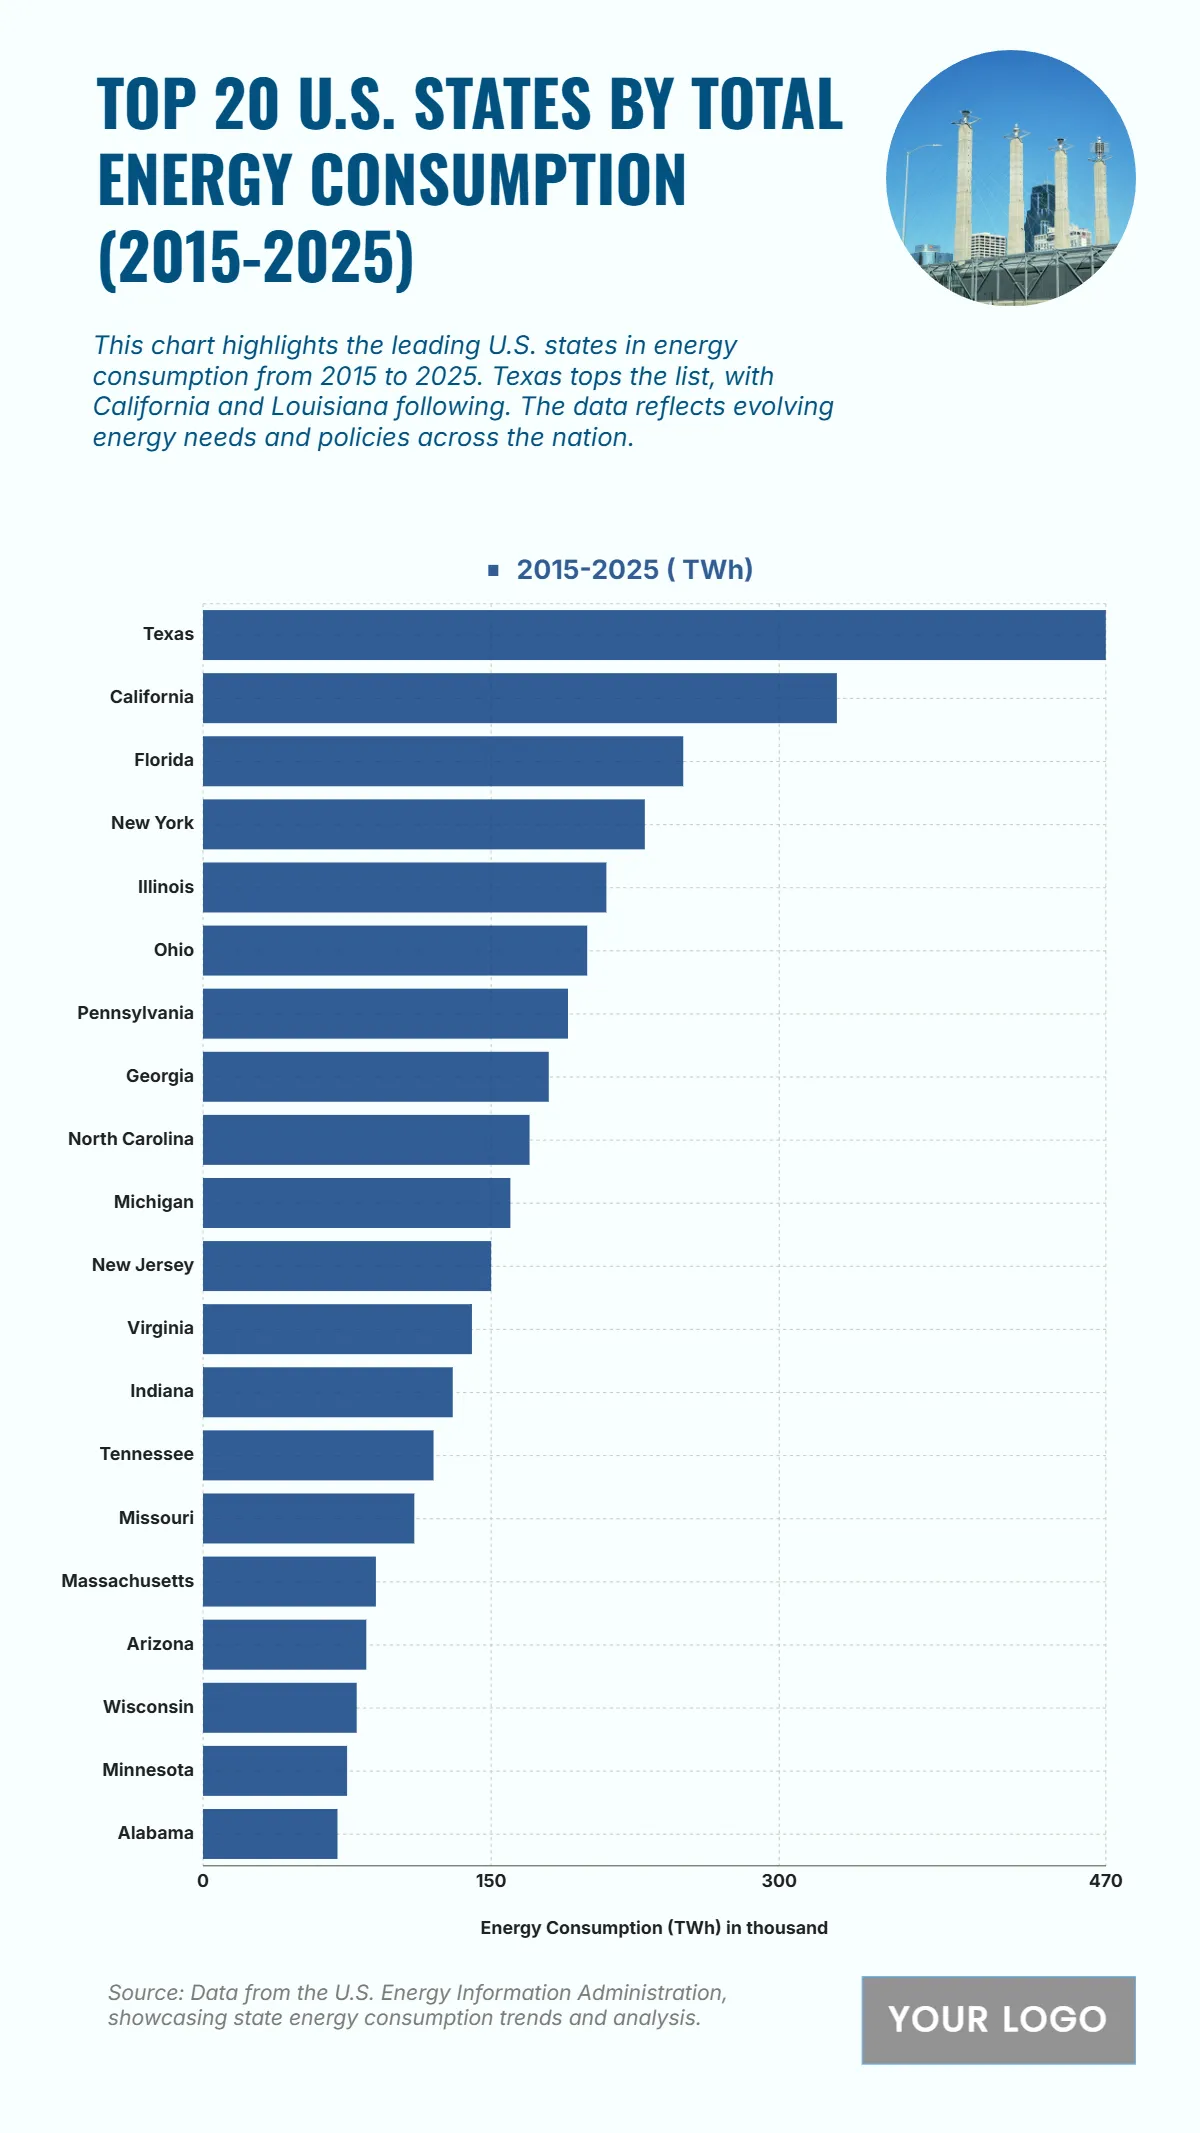
The chart highlights the top twenty U.S. states with the highest total energy consumption from 2015 to 2025, underscoring diverse industrial and population-driven demands. Texas leads the nation, consuming over 450 terawatt-hours (TWh), primarily due to its extensive industrial base and energy-intensive sectors. California follows at around 380 TWh, fueled by dense urban populations and strong commercial activity. Florida ranks third with approximately 300 TWh, reflecting growth in residential and tourism-related energy use. New York and Illinois record about 250 TWh and 230 TWh, highlighting substantial metropolitan consumption. States like Ohio, Pennsylvania, and Georgia maintain levels between 200–220 TWh, while North Carolina and Michigan report similar figures near 190 TWh. The remaining states, including Virginia, Indiana, and Tennessee, display steady demand patterns. Overall, the data reveals rising consumption trends tied to economic expansion, population growth, and ongoing shifts in industrial and renewable energy use.
| Labels |
2015-2025 (TWh) |
| Texas | 470 |
| California | 330 |
| Florida | 250 |
| New York | 230 |
| Illinois | 210 |
| Ohio | 200 |
| Pennsylvania | 190 |
| Georgia | 180 |
| North Carolina | 170 |
| Michigan | 160 |
| New Jersey | 150 |
| Virginia | 140 |
| Indiana | 130 |
| Tennessee | 120 |
| Missouri | 110 |
| Massachusetts | 90 |
| Arizona | 85 |
| Wisconsin | 80 |
| Minnesota | 75 |
| Alabama | 70 |


