Free Top 10 U.S. States by Lowest Wage Growth (2018-2025) Chart
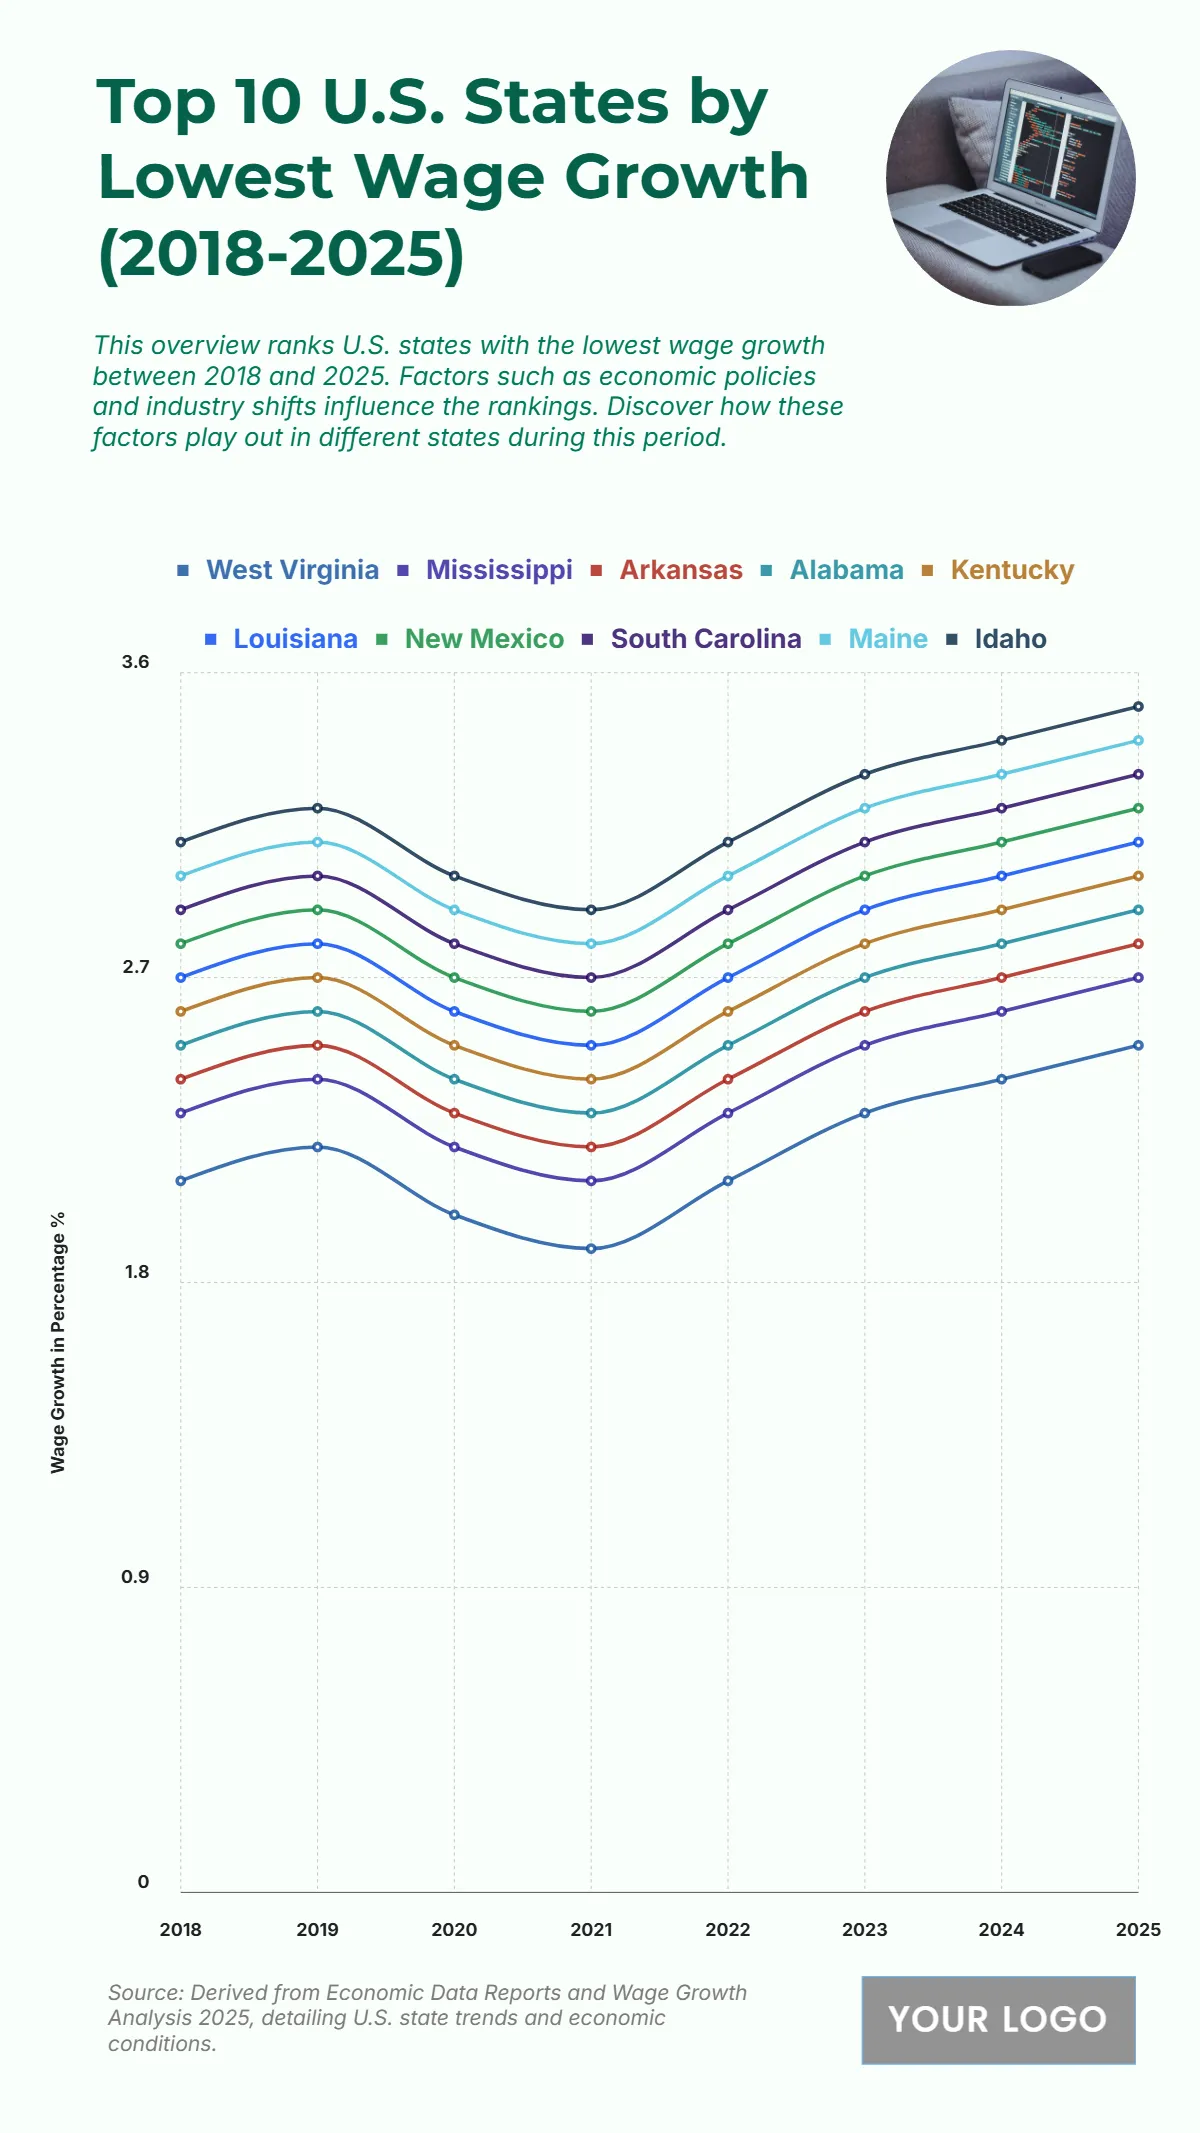
The chart presents the ten U.S. states with the lowest wage growth from 2018 to 2025, illustrating regional disparities and slow labor market expansion. West Virginia records the weakest growth, averaging around 2.1%, reflecting limited industrial diversification and wage stagnation. Mississippi follows with approximately 2.3%, hindered by low-wage sectors and limited investment. Arkansas and Alabama show modest gains near 2.5%, driven by small-scale economic development. Kentucky reports roughly 2.6%, indicating gradual improvement but below national averages. Louisiana and New Mexico post similar growth around 2.7%, constrained by fluctuations in energy and service industries. South Carolina, Maine, and Idaho demonstrate slightly higher rates between 2.8% and 3.2%, showing gradual but steady progress. Overall, the data underscores the persistent wage gap between these slower-growing states and more dynamic U.S. regions, emphasizing the need for stronger job creation and workforce development initiatives.
| Labels | West Virginia | Mississippi | Arkansas | Alabama | Kentucky | Louisiana | New Mexico | South Carolina | Maine | Idaho |
| 2018 | 2.1 | 2.3 | 2.4 | 2.5 | 2.6 | 2.7 | 2.8 | 2.9 | 3 | 3.1 |
| 2019 | 2.2 | 2.4 | 2.5 | 2.6 | 2.7 | 2.8 | 2.9 | 3 | 3.1 | 3.2 |
| 2020 | 2 | 2.2 | 2.3 | 2.4 | 2.5 | 2.6 | 2.7 | 2.8 | 2.9 | 3 |
| 2021 | 1.9 | 2.1 | 2.2 | 2.3 | 2.4 | 2.5 | 2.6 | 2.7 | 2.8 | 2.9 |
| 2022 | 2.1 | 2.3 | 2.4 | 2.5 | 2.6 | 2.7 | 2.8 | 2.9 | 3 | 3.1 |
| 2023 | 2.3 | 2.5 | 2.6 | 2.7 | 2.8 | 2.9 | 3 | 3.1 | 3.2 | 3.3 |
| 2024 | 2.4 | 2.6 | 2.7 | 2.8 | 2.9 | 3 | 3.1 | 3.2 | 3.3 | 3.4 |
| 2025 | 2.5 | 2.7 | 2.8 | 2.9 | 3 | 3.1 | 3.2 | 3.3 | 3.4 | 3.5 |


