Get Access to World’s largest Template Library & Tools

How to Calculate Z Score in Microsoft Excel

Microsoft Excel is a powerful tool for calculating Z Scores, an essential task in statistical analysis for students, researchers, and data analysts. This guide simplifies the process, offering step-by-step instructions to compute Z Scores to normalize data within a spreadsheet‘s dataset.
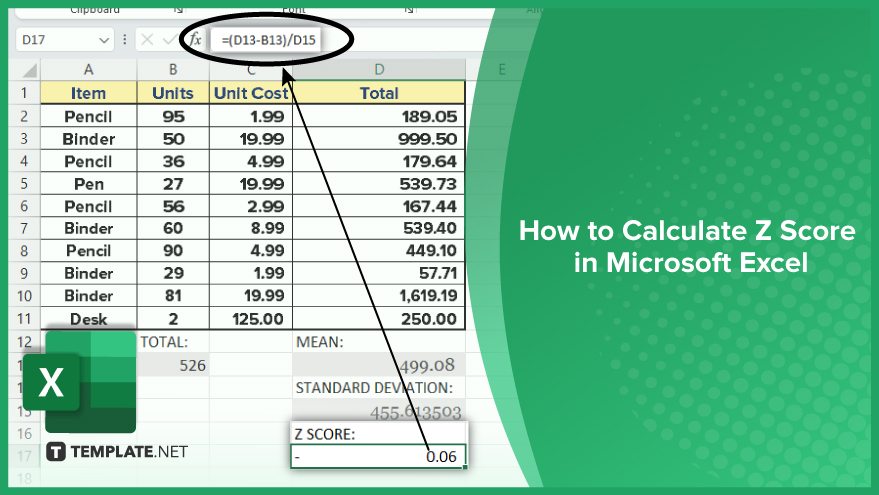
How to Calculate Z Score in Microsoft Excel


  • Step 1. Understanding What Z Score Is

    Microsoft Excel stands out for its ability to perform complex calculations, including the computation of Z scores. While Excel lacks a direct function for Z scores, you can calculate them using a formula: Z = (X – ?) / ?. Here, Z represents the Z score, X is the value of the element, ? is the population mean, and ? is the standard deviation. The AVERAGE function in Excel can determine the mean, while the STDEV.P function calculates the standard deviation.

  • Step 2. Calculating the Mean

    step

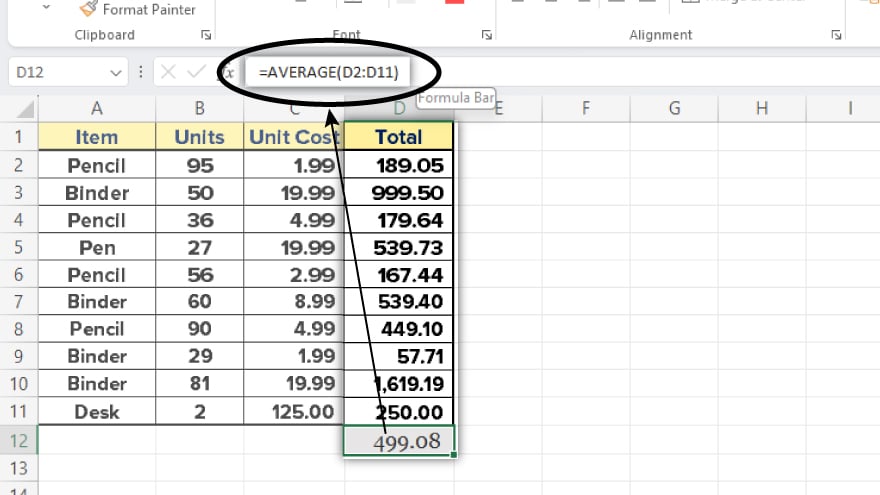
    Calculate your dataset’s mean using Excel’s AVERAGE function. For instance, if your data is in column A, enter =AVERAGE(A:A) in a cell to find the mean. You can learn an in-depth approach to this by studying how to calculate the mean in Microsoft Excel.

  • Step 3. Calculating Standard Deviation
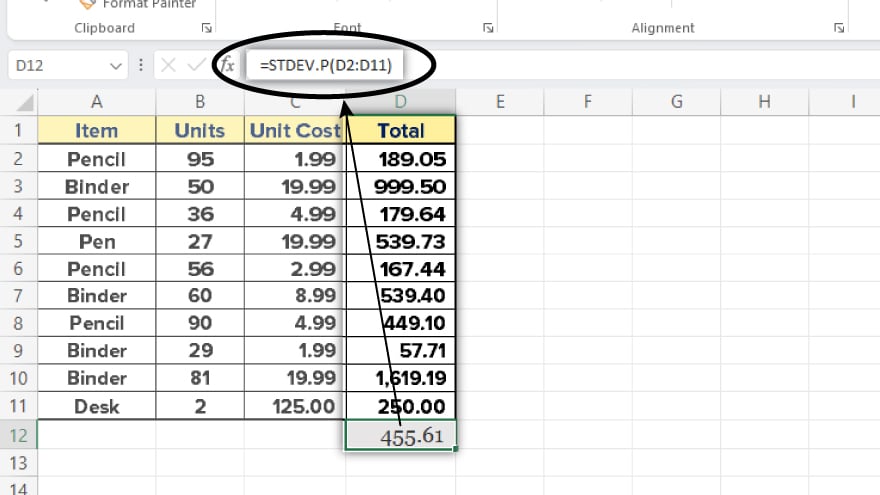
    step

    Following the mean calculation, determine the standard deviation of your dataset using the STDEV.P function. For data in column A, typing =STDEV.P(A:A) in a cell will yield the standard deviation.

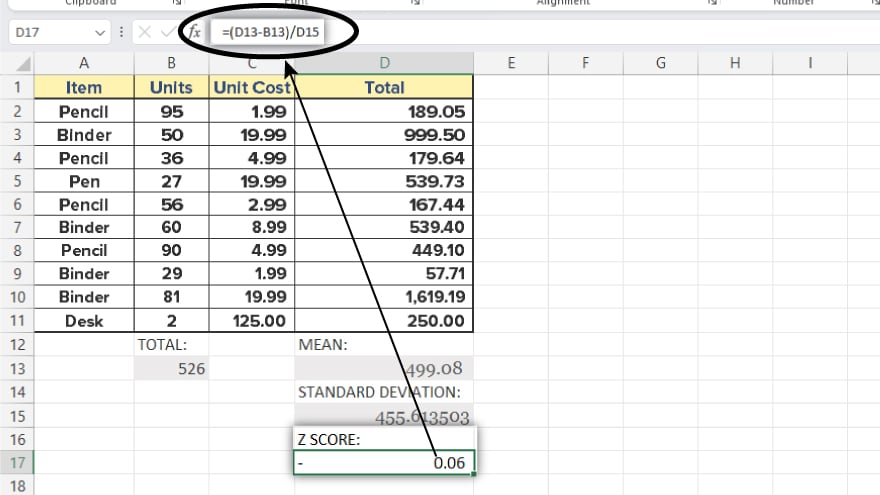
  • Step 4. Calculating Z Score

    step

    With the mean and standard deviation at hand, you’re now set to calculate the Z score for each data point. Subtract the mean from the data point and then divide this by the standard deviation. For example, if a data point is in cell A2, with the mean in B1 and standard deviation in B2, the Z score is computed by =(A2-B1)/B2.

You may also find valuable insights in the following articles offering tips for Microsoft Excel:

Step 5. Interpreting the Z Score

Interpreting the Z score is the final step. A Z score of 0 signifies that the data point aligns precisely with the mean. Positive Z scores indicate data points above the mean, while negative scores denote those below. The magnitude of a Z score reveals the distance of a data point from the mean, measured in standard deviations. For instance, a Z score of 1.0 implies the data point is one standard deviation from the mean, 2.0 indicates two standard deviations, and so forth. Also, check out how to get data analysis in Microsoft Excel.

note iconNote

Unlock Your Productivity with Over 100,000 Microsoft Excel Templates! Exclusively Available at Template.net – Download Now and Transform Your Data Handling Experience!

FAQs

What is a Z score in Excel?

A Z score in Excel is a statistical measurement that indicates the number of standard deviations a data point is from the mean of a dataset.

Can Excel automatically calculate a Z score for me?

Excel doesn’t have a built-in Z score function, but you can calculate it using the formula Z = (X – ?) / ?, combining the AVERAGE and STDEV.P functions.

How do I calculate the mean and standard deviation needed for a Z score in Excel?

Use the AVERAGE function for the mean (e.g., =AVERAGE(A:A)) and the STDEV.P function for the standard deviation (e.g., =STDEV.P(A:A)) in Excel.

What does a high Z score indicate in an Excel dataset?

A high Z score indicates that the data point is significantly above the mean of the dataset.

Is it possible to calculate Z scores for a whole column of data in Excel?

Yes, you can calculate Z scores for an entire column by applying the Z score formula to each cell in the column using relative cell references.

More in Excel

How to Add Symbols in Microsoft ExcelHow to Name Sheets in Microsoft Excel
How to Add One Month in Microsoft ExcelHow to Create Barcodes in Microsoft Excel
How to Use Quick Analysis in Microsoft ExcelHow to Freeze Top Three Rows in Microsoft Excel
How to Change the Legend in Microsoft ExcelHow to Put Names in Alphabetical Order in Excel
How to Calculate Sum in Microsoft ExcelHow to Update a Chart in Microsoft Excel
How to Create a Comparison Chart in Microsoft ExcelHow to Create Named Ranges in Microsoft Excel
How to Repeat a Formula in Microsoft ExcelHow to Create Dropdown Options in Microsoft Excel
How to Enter a Date in Microsoft ExcelHow to Combine Two Charts in Microsoft Excel
How to Refresh a Chart in Microsoft ExcelHow to Plot on Microsoft Excel
How to Insert a Document in Microsoft ExcelHow to Combine Charts in Microsoft Excel
How to Change Theme Colors in Microsoft ExcelHow to Switch Two Columns in Microsoft Excel
How to Filter Dates in Microsoft ExcelHow to Clear Data Validation in Microsoft Excel
How to Make Address Labels from Microsoft ExcelHow to Add a Chart Title in Microsoft Excel
How to Create Columns in Microsoft ExcelHow to Zoom Out on Microsoft Excel
How to Average Percentages in Microsoft ExcelHow to Insert the Slicer in Microsoft Excel
How to Unlock a Cell in Microsoft ExcelHow to Create Line Graphs in Microsoft Excel
How to Convert Hours and Minutes to Decimal in Microsoft ExcelHow to Remove Dollar Signs in Microsoft Excel
How to Turn on Autosave in Microsoft ExcelHow to Insert a Word Document into Microsoft Excel
How to Convert Date to Text in Microsoft ExcelHow to Add Microsoft Excel Add Ins
How to Combine Three Columns in Microsoft ExcelHow to Duplicate a Microsoft Excel File
How to Build a Dashboard in Microsoft ExcelHow to Write Exponents in Microsoft Excel
How to Change the Theme in Microsoft ExcelHow to Count Specific Words in Microsoft Excel
How to Add a Linear Trendline in Microsoft ExcelHow to Use Text to Columns in Microsoft Excel
How to Edit a Microsoft Excel SheetHow to Insert Blank Rows in Microsoft Excel
How to Insert Symbol in Microsoft ExcelHow to See Macros in Microsoft Excel
How to Rotate Pie Chart in Microsoft ExcelHow to Find Probability on Microsoft Excel
How to Insert a Title in Microsoft ExcelHow to Enlarge Cells in Microsoft Excel
How to Create Boxes in Microsoft ExcelHow to Embed Microsoft Excel into Word
How to Insert a Cell in Microsoft ExcelHow to Combine 3 Columns in Microsoft Excel
How to Make Columns the Same Size in Microsoft ExcelHow to Enter a Line Break in Microsoft Excel
How to Show Leading Zeros in Microsoft ExcelHow to Zip a Microsoft Excel File
How to Select an Entire Row in Microsoft ExcelHow to Unhide Everything in Microsoft Excel
How to Sign in on Microsoft ExcelHow to Insert a Formula in Microsoft Excel
How to Make Rows the Same Size in Microsoft ExcelHow to Type a Check Mark in Microsoft Excel
How to Create a Timesheet in Microsoft ExcelHow to Rotate a Pie Chart in Microsoft Excel
How to Use Filters in Microsoft ExcelHow to Add Arrows in Microsoft Excel
How to Delete Blank Spaces in Microsoft ExcelHow to Delete Excess Rows in Microsoft Excel
How to Match Data in Microsoft ExcelHow to Change the Color of an Excel Cell
How to Auto-Adjust Column Width in Microsoft ExcelHow to Make Boxes in Microsoft Excel
How to Round Up a Number in Microsoft ExcelHow to Show the Toolbar in Microsoft Excel
How to Add a New Line in Microsoft ExcelHow to Merge on Microsoft Excel
How to See Changes Made in Microsoft ExcelHow to Add Comma to Numbers in Microsoft Excel
How to Make a Hyperlink in Microsoft ExcelHow to Insert Arrows in Microsoft Excel
How to Add Headers on Microsoft ExcelHow to Make Comparison Charts in Microsoft Excel
How to Code in Microsoft ExcelHow to Write a Paragraph in Microsoft Excel
How to Find on Microsoft ExcelHow to Select All Rows in Microsoft Excel
How to Create a Weekly Schedule in Microsoft ExcelHow To Add 2 Columns in Microsoft Excel
How to Export Microsoft Excel to PDFHow to Add Vertical Lines in an Excel Graph
How to Wrap a Cell in Microsoft ExcelHow to Add Dates in Microsoft Excel Automatically
How to Create a Flowchart in Microsoft ExcelHow to Change the Y Axis in Microsoft Excel
bottom banner