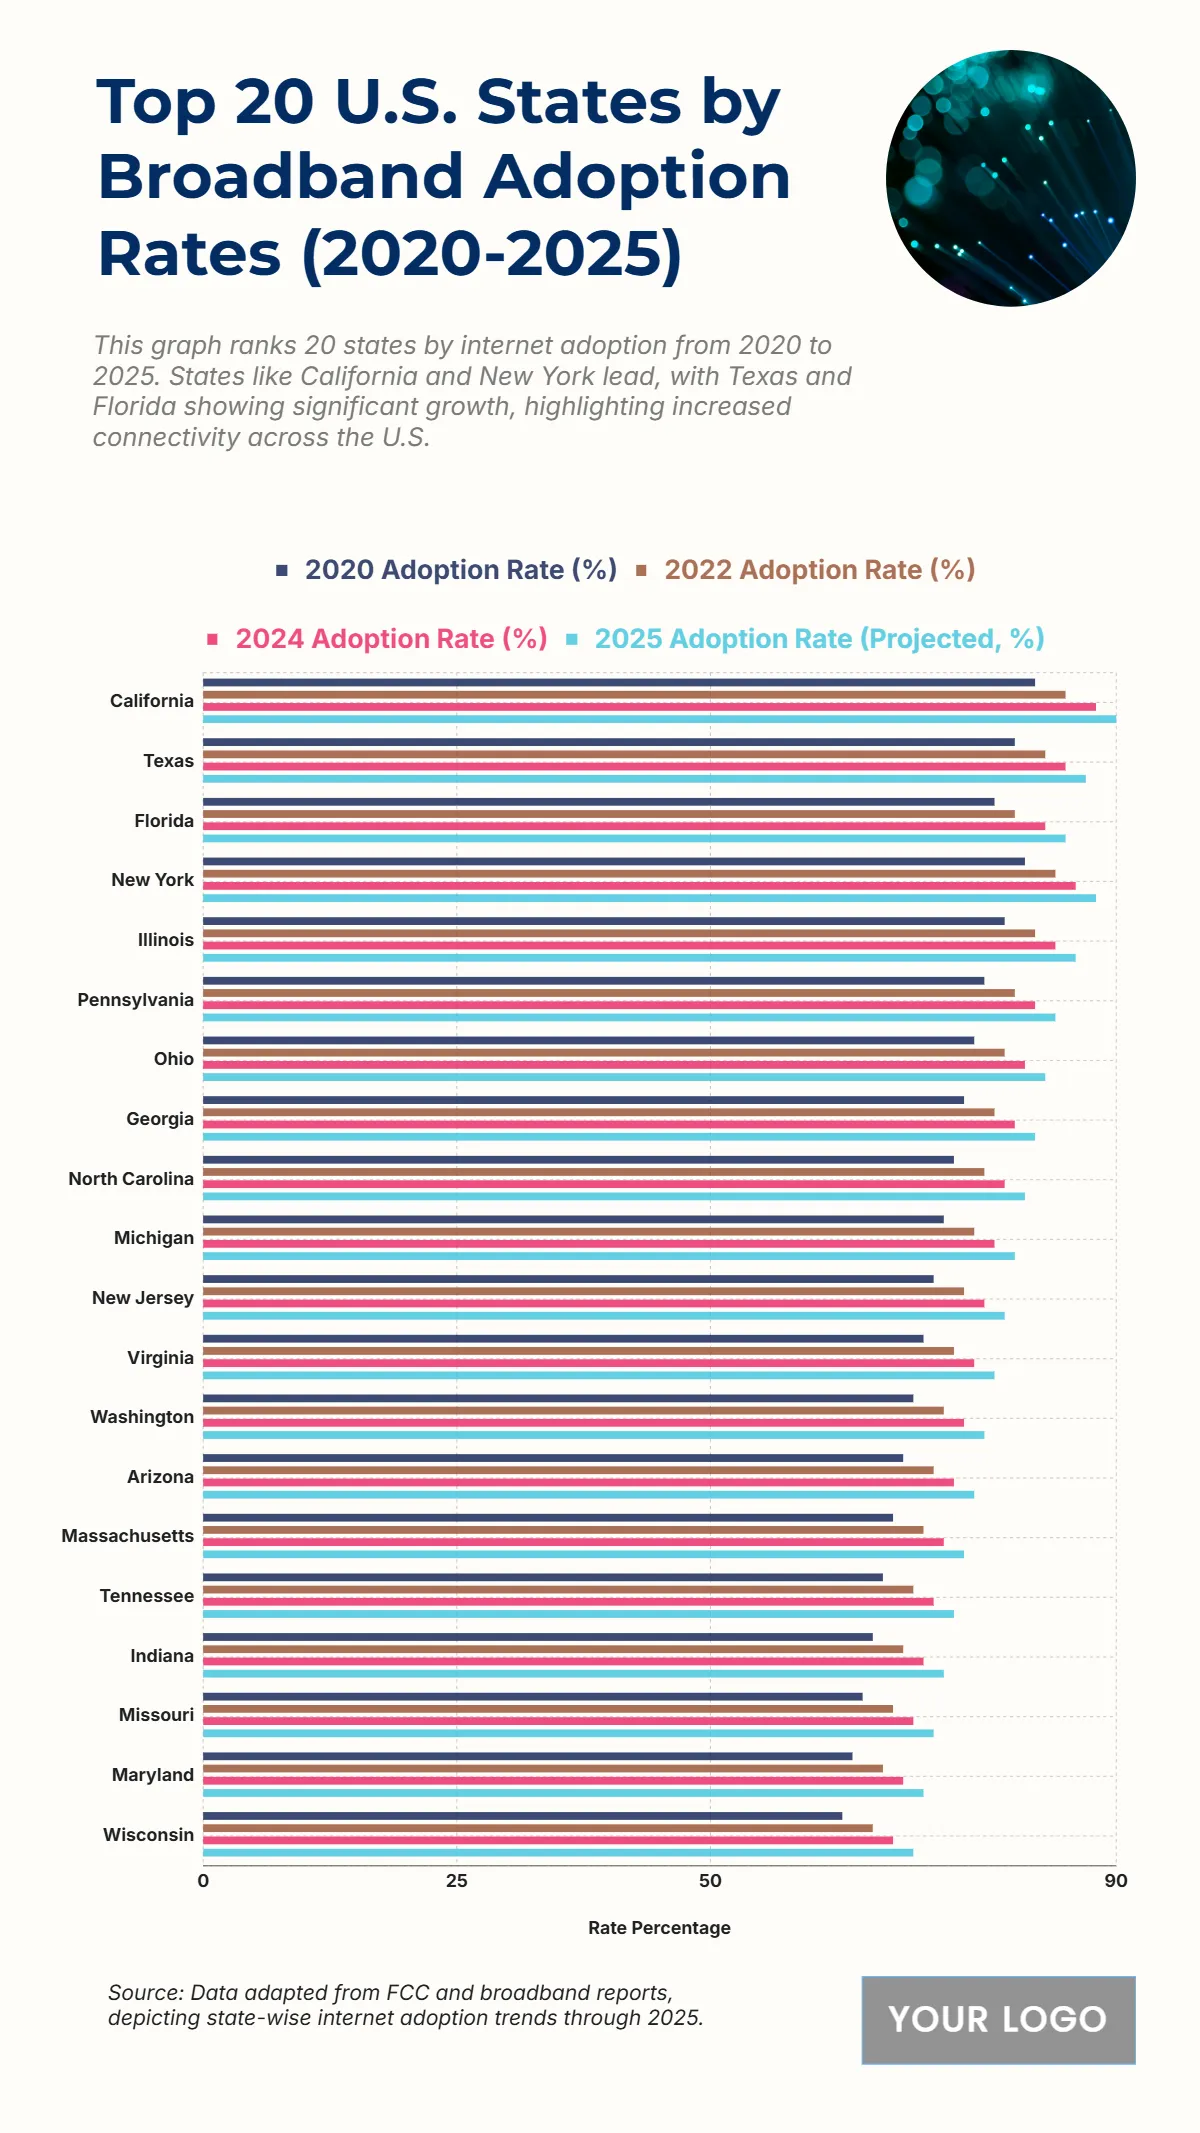
The chart highlights the top 20 U.S. states by broadband adoption rates from 2020 to 2025, illustrating steady growth in digital connectivity nationwide. California ranks first, with adoption rates climbing from around 78% in 2020 to nearly 92% by 2025, reflecting robust infrastructure and widespread digital inclusion initiatives. Texas follows closely, improving from 75% to over 90%, driven by state-funded broadband expansion and rural network upgrades. Florida and New York show comparable gains, each surpassing 88% adoption by 2025, supported by population density and competitive internet markets. Illinois, Pennsylvania, and Ohio maintain consistent progress, averaging 85–87% in recent years through public-private partnerships aimed at increasing access. Georgia, North Carolina, and Michigan achieve similar milestones, showcasing improved rural coverage. Northeastern states such as New Jersey and Massachusetts reach near-universal access levels by 2025, around 90–91%, while Washington and Virginia also perform strongly. Meanwhile, Tennessee, Indiana, and Missouri report marked improvements, climbing from roughly 70% to 85% adoption, illustrating closing digital gaps. Maryland and Wisconsin round out the list with moderate but steady growth. Overall, the data demonstrates significant national progress in broadband adoption, emphasizing equitable digital access and economic competitiveness as connectivity rates rise across urban and rural regions alike between 2020 and 2025.
| Labels | 2020 Adoption Rate (%) | 2022 Adoption Rate (%) | 2024 Adoption Rate (%) |
2025 Adoption Rate (Projected, %) |
| California | 82 | 85 | 88 | 90 |
| Texas | 80 | 83 | 85 | 87 |
| Florida | 78 | 80 | 83 | 85 |
| New York | 81 | 84 | 86 | 88 |
| Illinois | 79 | 82 | 84 | 86 |
| Pennsylvania | 77 | 80 | 82 | 84 |
| Ohio | 76 | 79 | 81 | 83 |
| Georgia | 75 | 78 | 80 | 82 |
| North Carolina | 74 | 77 | 79 | 81 |
| Michigan | 73 | 76 | 78 | 80 |
| New Jersey | 72 | 75 | 77 | 79 |
| Virginia | 71 | 74 | 76 | 78 |


