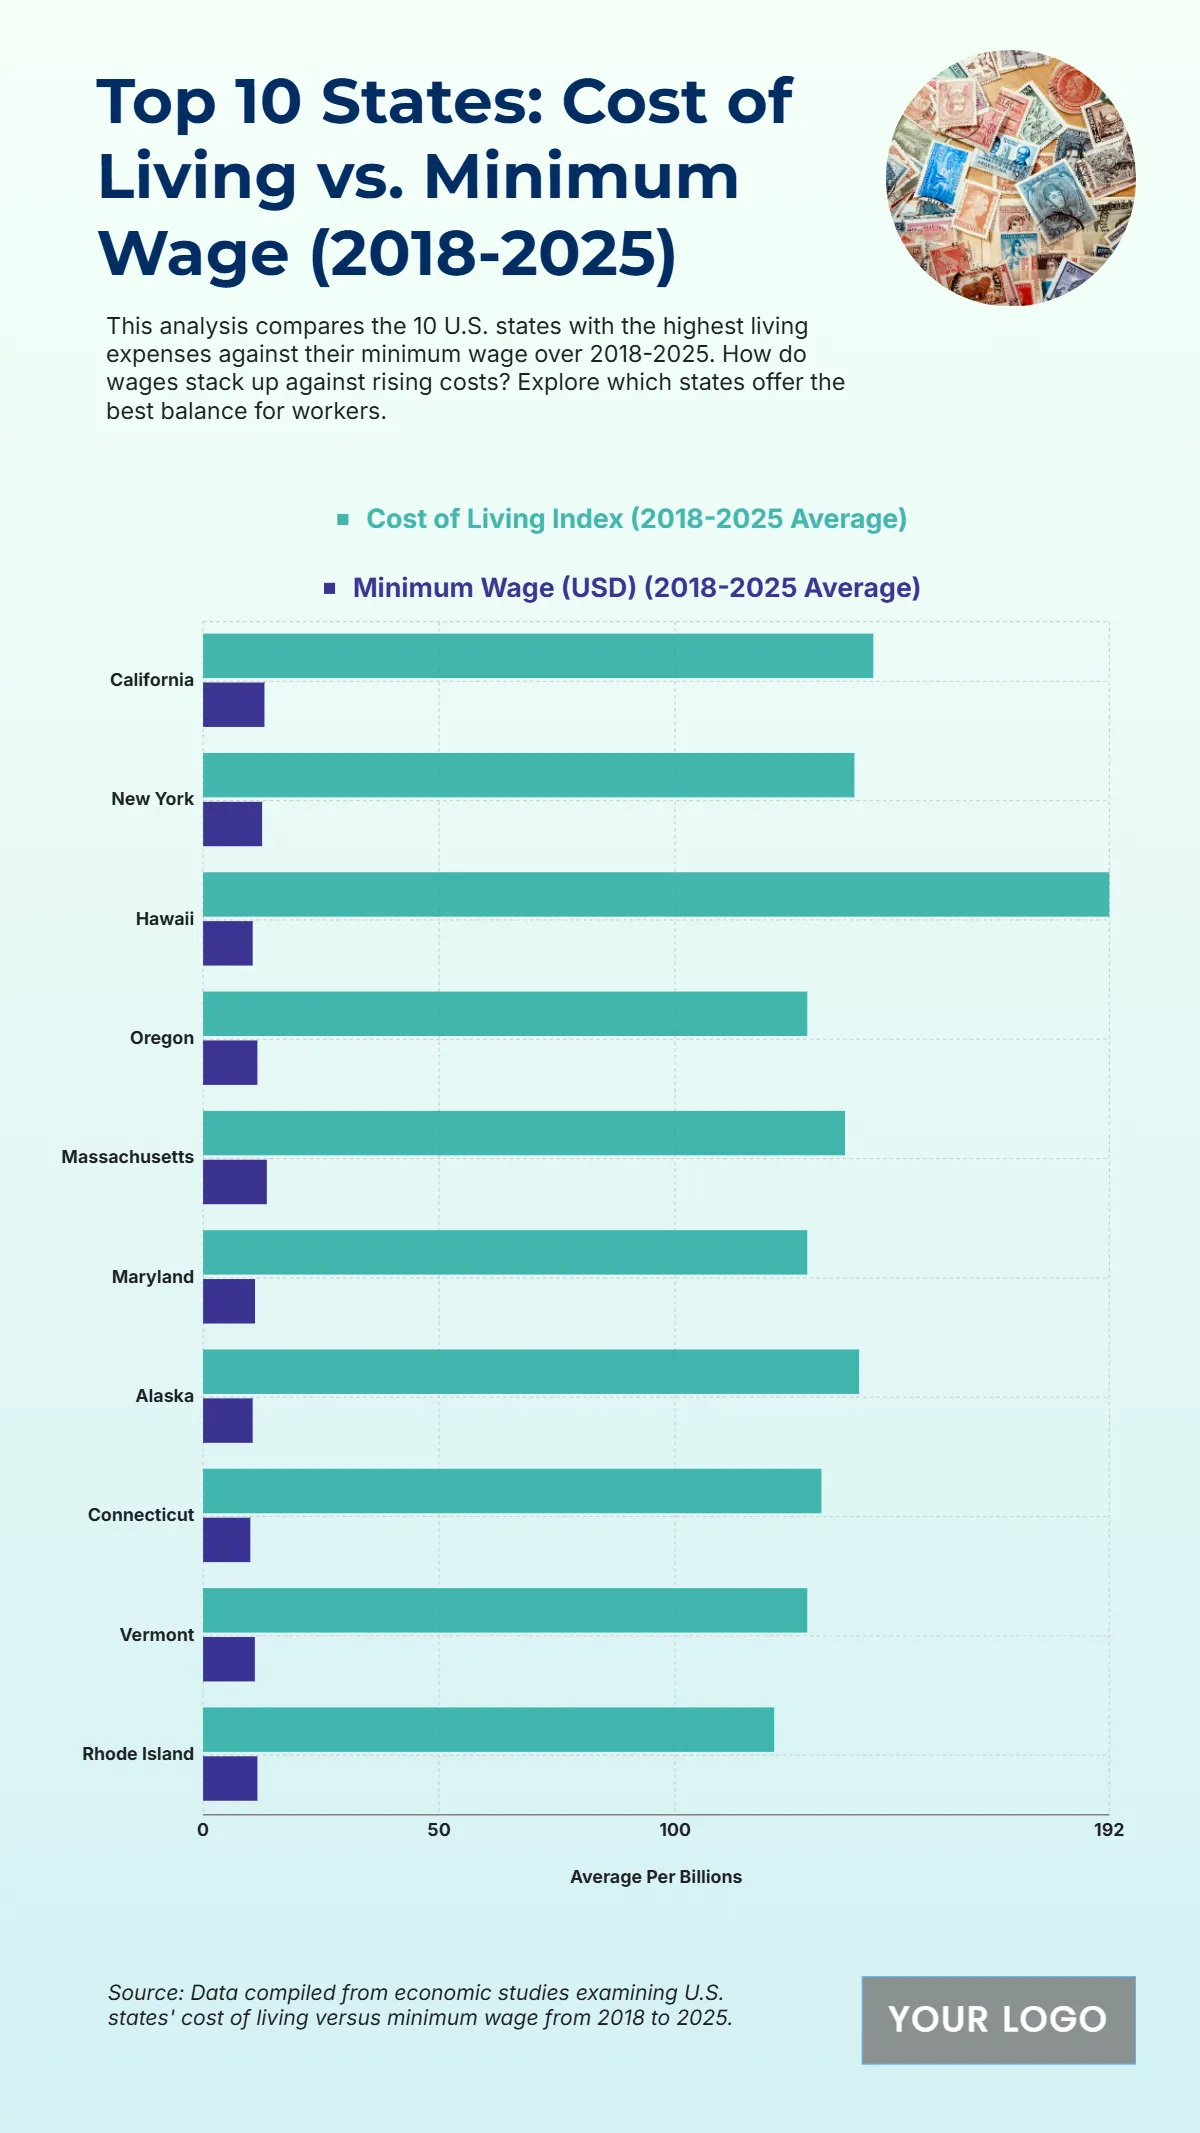
he chart compares the top 10 U.S. states by cost of living versus minimum wage averages from 2018 to 2025, revealing substantial disparities between income levels and living expenses. Hawaii tops the list with the highest Cost of Living Index, exceeding 190 points, despite having one of the nation’s higher minimum wages, indicating significant affordability challenges. California and New York follow, each with living cost averages surpassing 160 points, where housing and transportation drive financial pressure for lower-income workers. Oregon and Massachusetts maintain elevated living costs above 140 points, although both states have steadily raised minimum wages to offset inflation. Maryland and Alaska record balanced trends near 130 points, showing moderate wage support relative to expenses. Connecticut and Vermont approach similar figures, reflecting consistent but limited wage growth against increasing costs in utilities and housing. Rhode Island, while ranking last on the list, still demonstrates a notable gap between its cost of living index and minimum wage. Overall, the data underscores persistent wage-to-expense imbalances across high-cost states, emphasizing the ongoing struggle for workers to achieve sustainable living conditions despite gradual policy adjustments.
Free Top 10 U.S. States by Cost of Living vs. Minimum Wage (2018-2025)

- 100% Customizable, free editor
- Access 1 Million+ Templates, photo’s & graphics
- Download or share as a template
- Click and replace photos, graphics, text, backgrounds
- Resize, crop, AI write & more
- Access advanced editor
AI AI Chart and Graph Generator
Generate my free AI Chart and Graph Text or voice to generate a free AI Chart and Graph
| Labels | Cost of Living Index (2018-2025 Average) |
Minimum Wage (USD) (2018-2025 Average) |
| California | 142 | 13 |
| New York | 138 | 12.5 |
| Hawaii | 192 | 10.5 |
| Oregon | 128 | 11.5 |
| Massachusetts | 136 | 13.5 |
| Maryland | 128 | 11 |
| Alaska | 139 | 10.5 |
| Connecticut | 131 | 10 |
| Vermont | 128 | 10.96 |
| Rhode Island | 121 | 11.5 |
You may also like
- Bar Graph Chart
- Line Graph Chart
- Pie Graph Chart
- Table Graph Chart
- Scatter Graph Chart
- Area Graph Chart
- Tree Graph Chart
- Birth Chart
- Chore Chart
- Time Table Chart
- Dress Size Chart
- Football Depth Chart
- Color Chart
- Color Wheel Chart
- Color Mix Chart
- Classroom Seating Chart
- Church Organizational Chart
- Hierarchy Organizational Chart
- Tree Organizational Chart
- Organization Chart
- Time Chart
- Blood Pressure Chart
- Behavior Chart
- Process Flowchart
- Process Flow Chart
- Baby Feeding Chart
- BMI Chart
- Ring Size Chart
- Height Chart
- Number Chart
- Food Chart
- Baby Milestones Chart
- Blood Sugar Chart
- Body Temperature Chart
- Diet Chart
- Metric Chart
- Pregnancy Weight Gain Chart
- HCG Levels Chart
- Astrology Chart
- Blood Oxygen Level Chart
- Gauge Chart
- Sales Chart
- Marketing Chart
- Military Time Chart
- Pregnancy Food Chart
- Medical Chart
- Wedding Seating Chart
- Guitar Chord Chart
- Pedigree Chart
- Natal Chart
- Team Organizational Chart
- Feelings Chart
- Piano Chord Chart
- Shoe Size Chart
- Activity Chart
- Height Weight
- Eye Chart
- Chakra Chart
- Reflexology Chart
- Hospital Organizational Chart
- Radar Chart
- College Organizational Chart
- Column Chart
- Roman Numerals Chart
- Weather Chart
- Height Conversion Chart
- Food Calorie Chart
- Fundraising Chart
- Kids Chore Chart
- Donut Chart
- Incident Flow Chart
- Patient Chart
- Body Measurement Chart
- Synastry Chart
- Funnel Chart
- Goal Chart
- Weight Loss Chart
- Money Chart
- Research FlowChart
- Medical Organizational Chart
- Protein Chart
- Retail Organizational Chart
- Sports Organizational Chart
- Vitamin Chart
- Research Gantt Chart
- To Do Chart
- Tooth Chart
- Conjugation Chart
- Drug Chart
- Event FlowChart
- Gildan Size Chart
- Logistics Organizational Chart
- Production FlowChart
- Bank Organizational Chart
- Dental Chart
- Dissertation Gantt Chart
- Training Gantt Chart
- Warehouse Organizational Chart
- Army Weight Chart
- Communication FlowChart
- Face Chart
- Pharma Organizational Chart
- Travel Gantt Chart
- Gaming FlowChart
- Insurance Organizational Chart
- Manufacturing Chart
- Progress Chart
- Travel Organizational Chart
- Charity FlowChart
- Design Firm/Company Organizational Chart
- Hospital Gantt Chart
- Manufacturing Gantt Chart
- Recruitment Gantt Chart
- Website Gantt Chart
- Environment Organizational Chart
- Fire Organizational Chart


