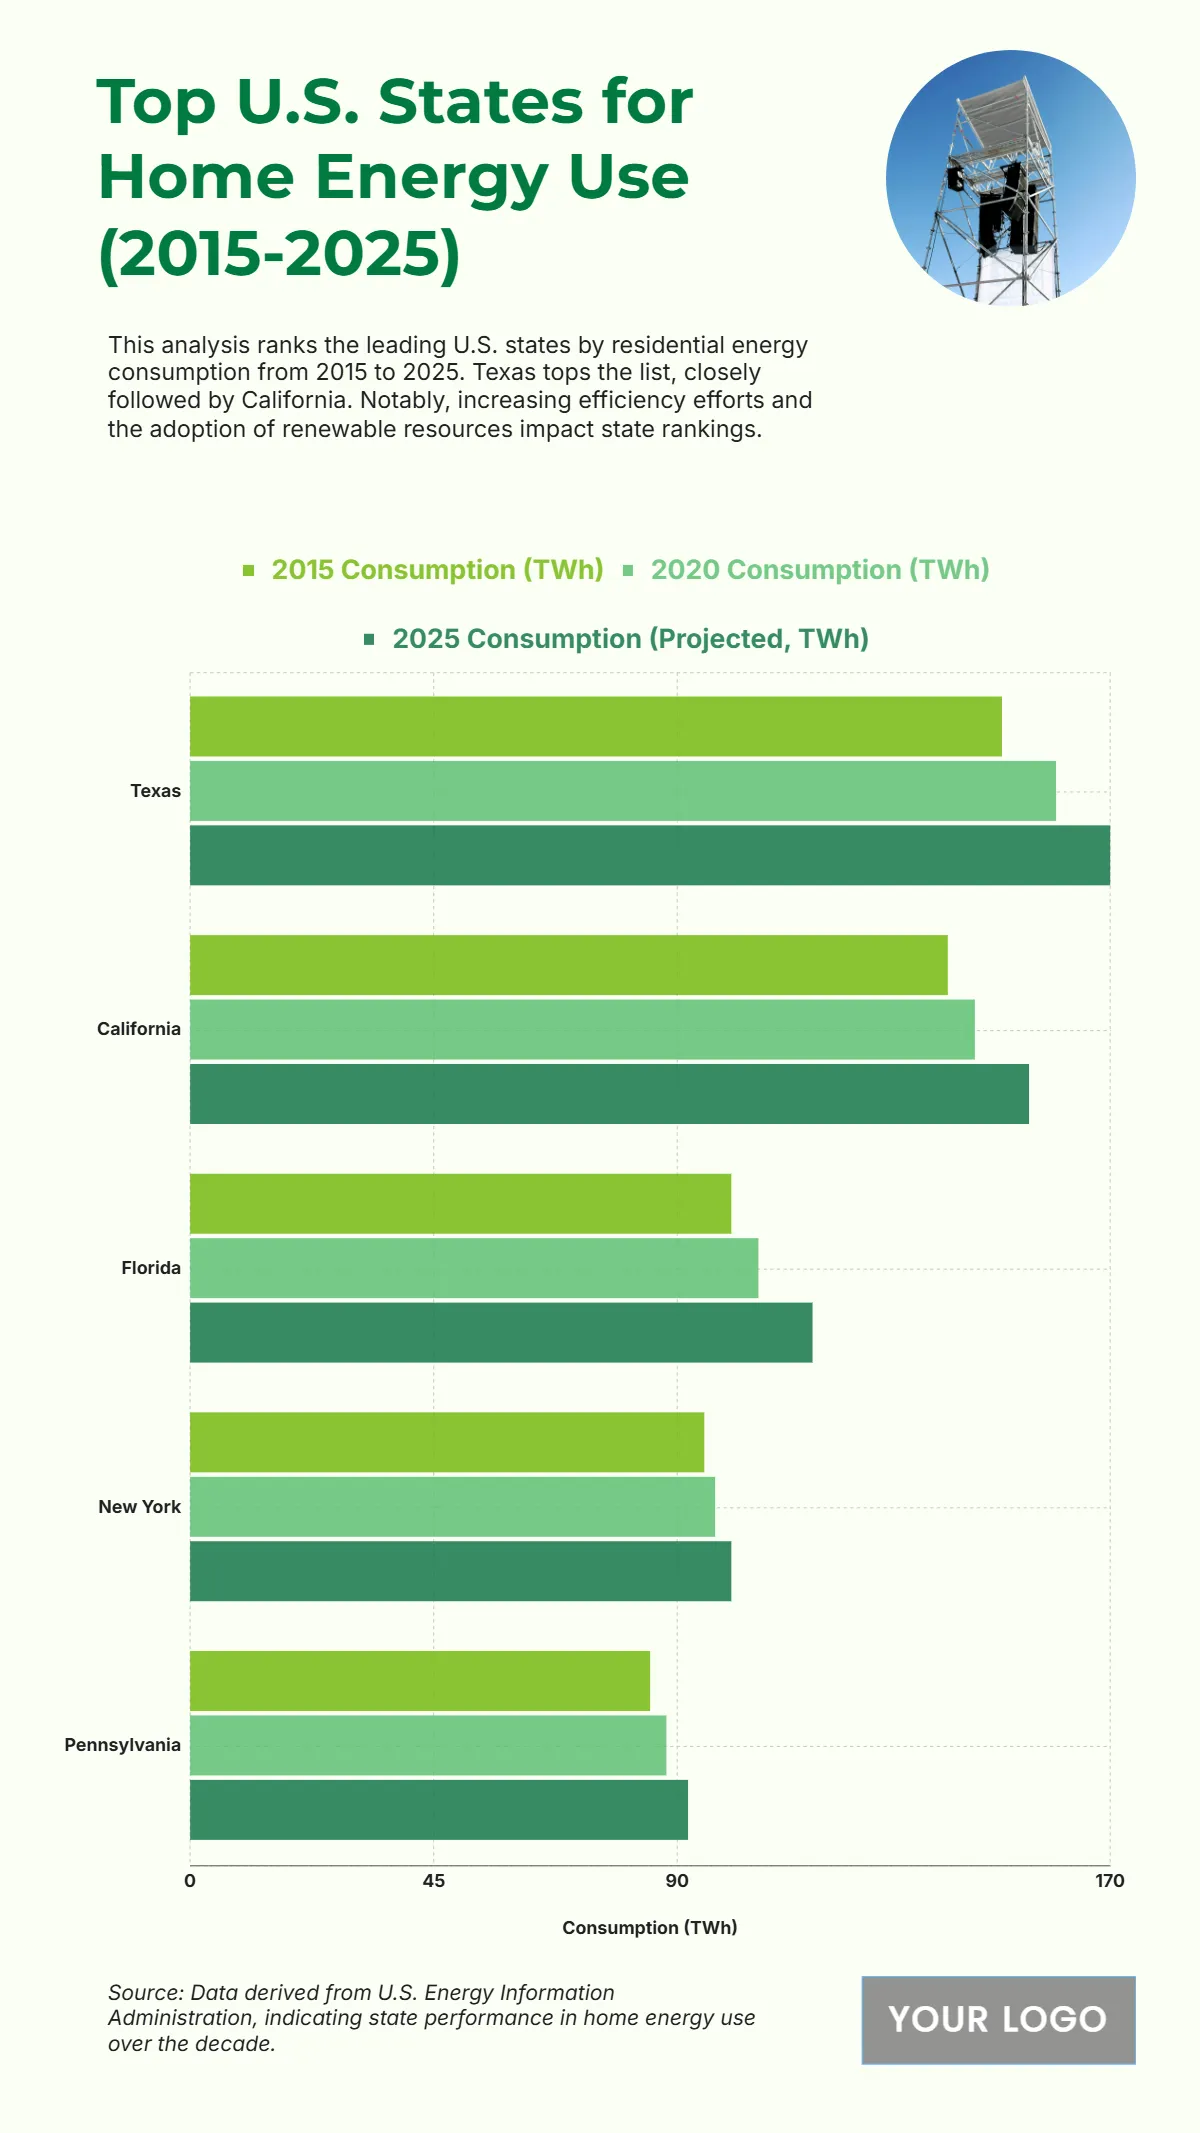
The chart highlights the top U.S. states for home energy use from 2015 to 2025, revealing residential consumption patterns shaped by climate, population, and renewable adoption. Texas leads consistently, with projected 2025 consumption nearing 170 TWh, driven by widespread air conditioning demand, large housing footprints, and population growth. California ranks second at around 150 TWh, reflecting extensive residential use balanced by strong energy efficiency initiatives and renewable integration efforts. Florida follows with approximately 130 TWh, where warm weather and increasing household density maintain steady demand. New York records about 100 TWh, supported by high population density and heating requirements in colder months, though efficiency programs continue to moderate growth. Pennsylvania closes the top five at roughly 90 TWh, driven by older housing stock and seasonal climate variations. Across all states, the decade-long trend shows a modest rise in consumption compared to 2015, underscoring both population expansion and improving energy efficiency standards. The data illustrates how regional climates and policy-driven conservation efforts shape U.S. residential energy behavior, with Texas and California remaining pivotal in defining national home energy trends through 2025.
| Labels | 2015 Consumption (TWh) | 2020 Consumption (TWh) |
2025 Consumption (Projected, TWh) |
| Texas | 150 | 160 | 170 |
| California | 140 | 145 | 155 |
| Florida | 100 | 105 | 115 |
| New York | 95 | 97 | 100 |
| Pennsylvania | 85 | 88 | 92 |


