Free Top 20 U.S. States by Consumer Debt-to-Income Ratio (2020-2025)
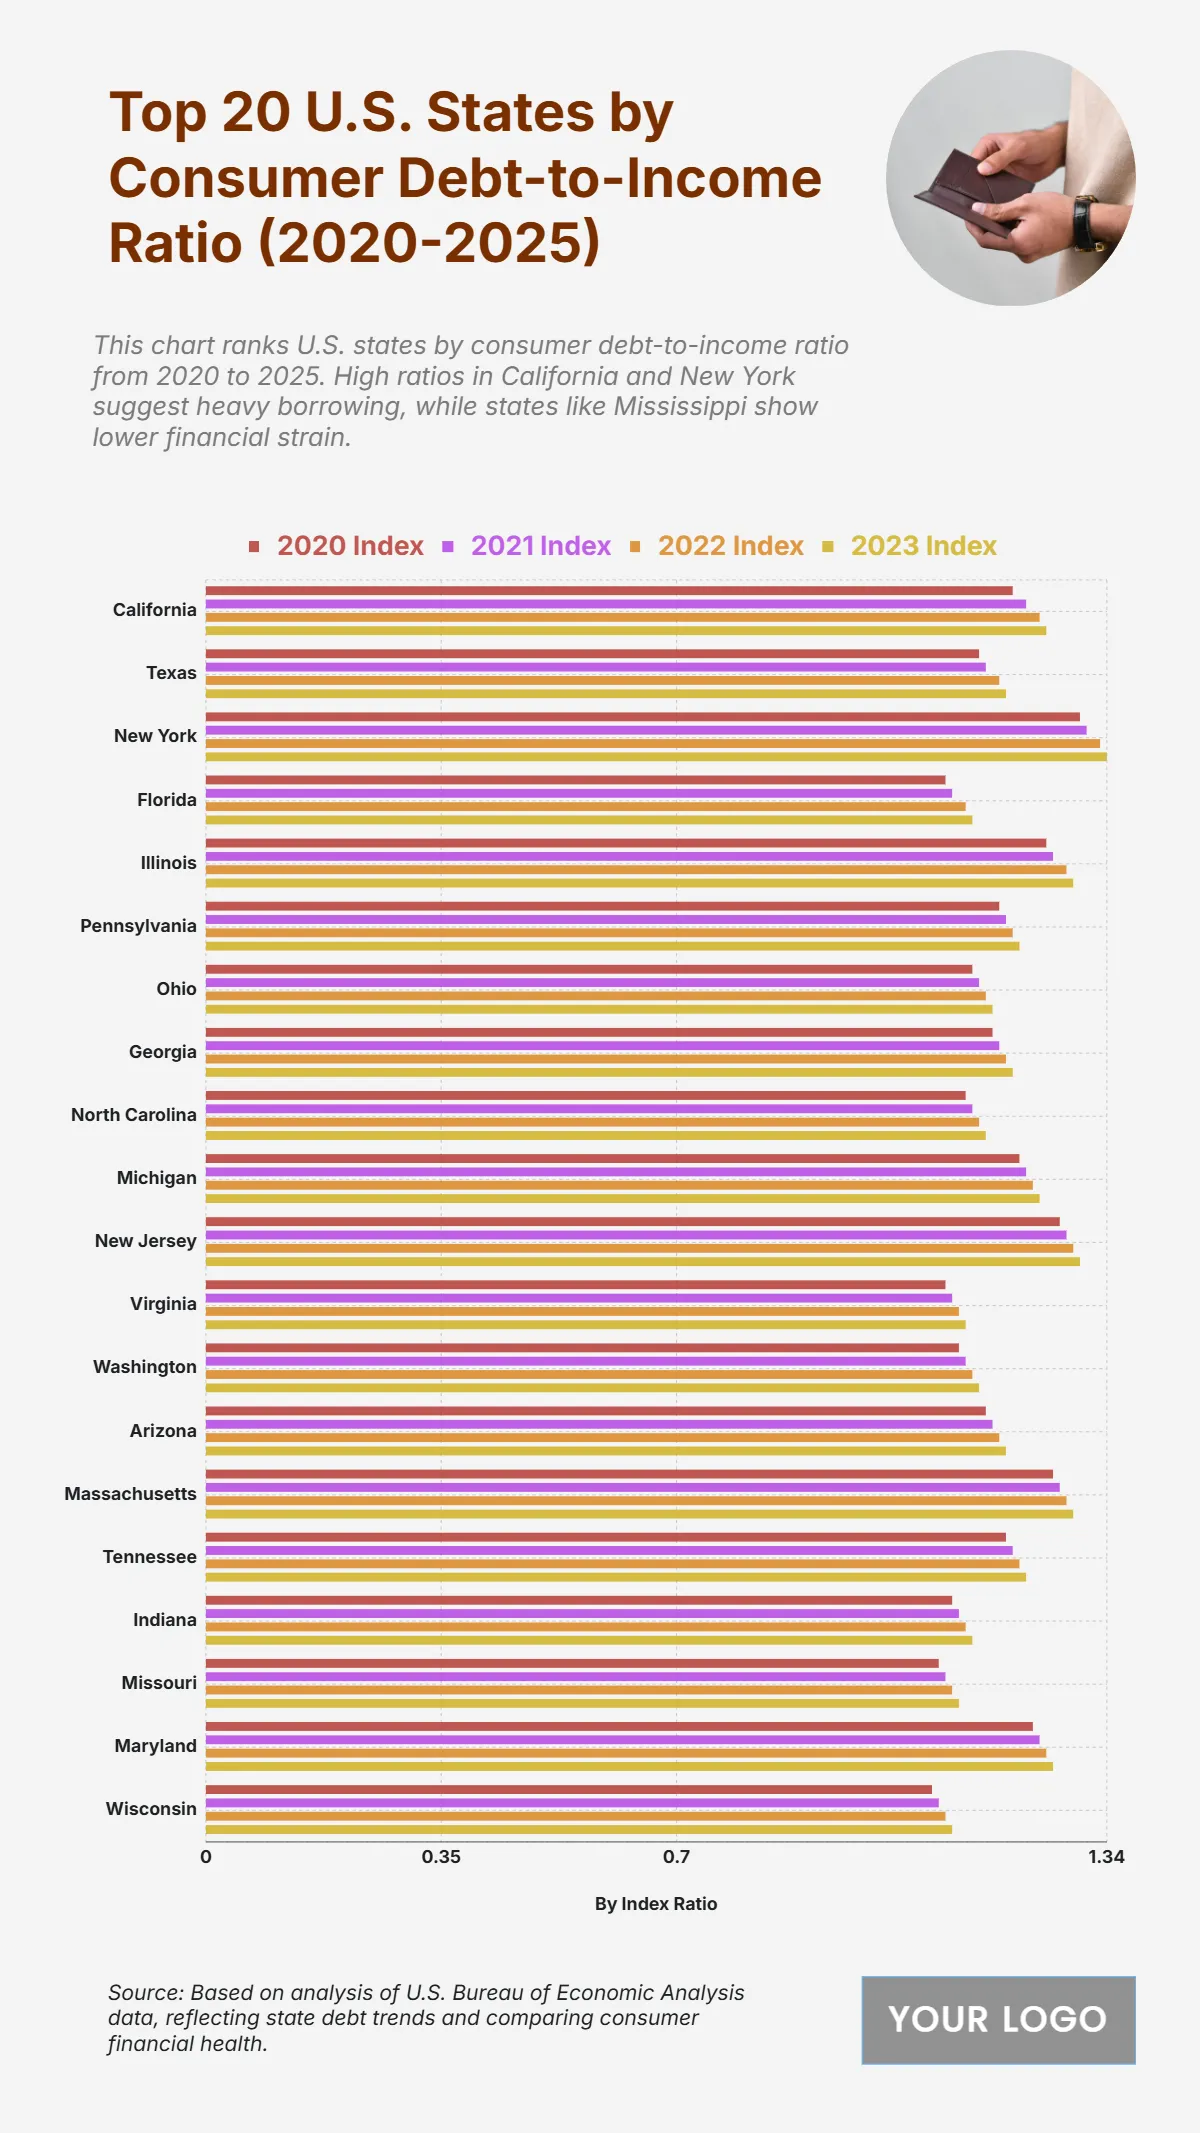
The chart shows a steady rise in consumer debt-to-income ratios from 2020 to 2025, with New York leading at 1.34 in 2023, followed closely by Massachusetts (1.29), Illinois (1.29), and New Jersey (1.3), indicating high levels of consumer borrowing relative to income. California climbs from 1.20 in 2020 to 1.25 in 2023, reflecting consistent financial pressure. Texas also shows gradual growth from 1.15 to 1.19, while Florida remains lower at 1.14 in 2023, suggesting more stable consumer debt levels. States like Wisconsin (1.11) and Missouri (1.12) remain among the lowest, indicating lower household leverage compared to income. Other states such as Michigan, Georgia, Ohio, and Pennsylvania show moderate increases but remain below the highest ratio levels. Overall, the data reflects a national upward trend in debt-to-income ratios, signaling growing financial obligations across most states.
| Labels | 2020 Index | 2021 Index | 2022 Index | 2023 Index |
|---|---|---|---|---|
| California | 1.20 | 1.22 | 1.24 | 1.25 |
| Texas | 1.15 | 1.16 | 1.18 | 1.19 |
| New York | 1.30 | 1.31 | 1.33 | 1.34 |
| Florida | 1.10 | 1.11 | 1.13 | 1.14 |
| Illinois | 1.25 | 1.26 | 1.28 | 1.29 |
| Pennsylvania | 1.18 | 1.19 | 1.20 | 1.21 |
| Ohio | 1.14 | 1.15 | 1.16 | 1.17 |
| Georgia | 1.17 | 1.18 | 1.19 | 1.20 |
| North Carolina | 1.14 | 1.15 | 1.15 | 1.16 |
| Michigan | 1.21 | 1.22 | 1.23 | 1.24 |
| New Jersey | 1.27 | 1.28 | 1.29 | 1.30 |
| Virginia | 1.10 | 1.11 | 1.12 | 1.13 |
| Washington | 1.12 | 1.13 | 1.14 | 1.15 |
| Arizona | 1.16 | 1.17 | 1.18 | 1.19 |
| Massachusetts | 1.26 | 1.27 | 1.28 | 1.29 |
| Tennessee | 1.19 | 1.20 | 1.21 | 1.22 |
| Indiana | 1.11 | 1.12 | 1.13 | 1.14 |
| Missouri | 1.09 | 1.10 | 1.11 | 1.12 |
| Maryland | 1.23 | 1.24 | 1.25 | 1.26 |
| Wisconsin | 1.08 | 1.09 | 1.10 | 1.10 |


