Free US Mobile Internet Penetration Rate from 2010 to 2025 Chart
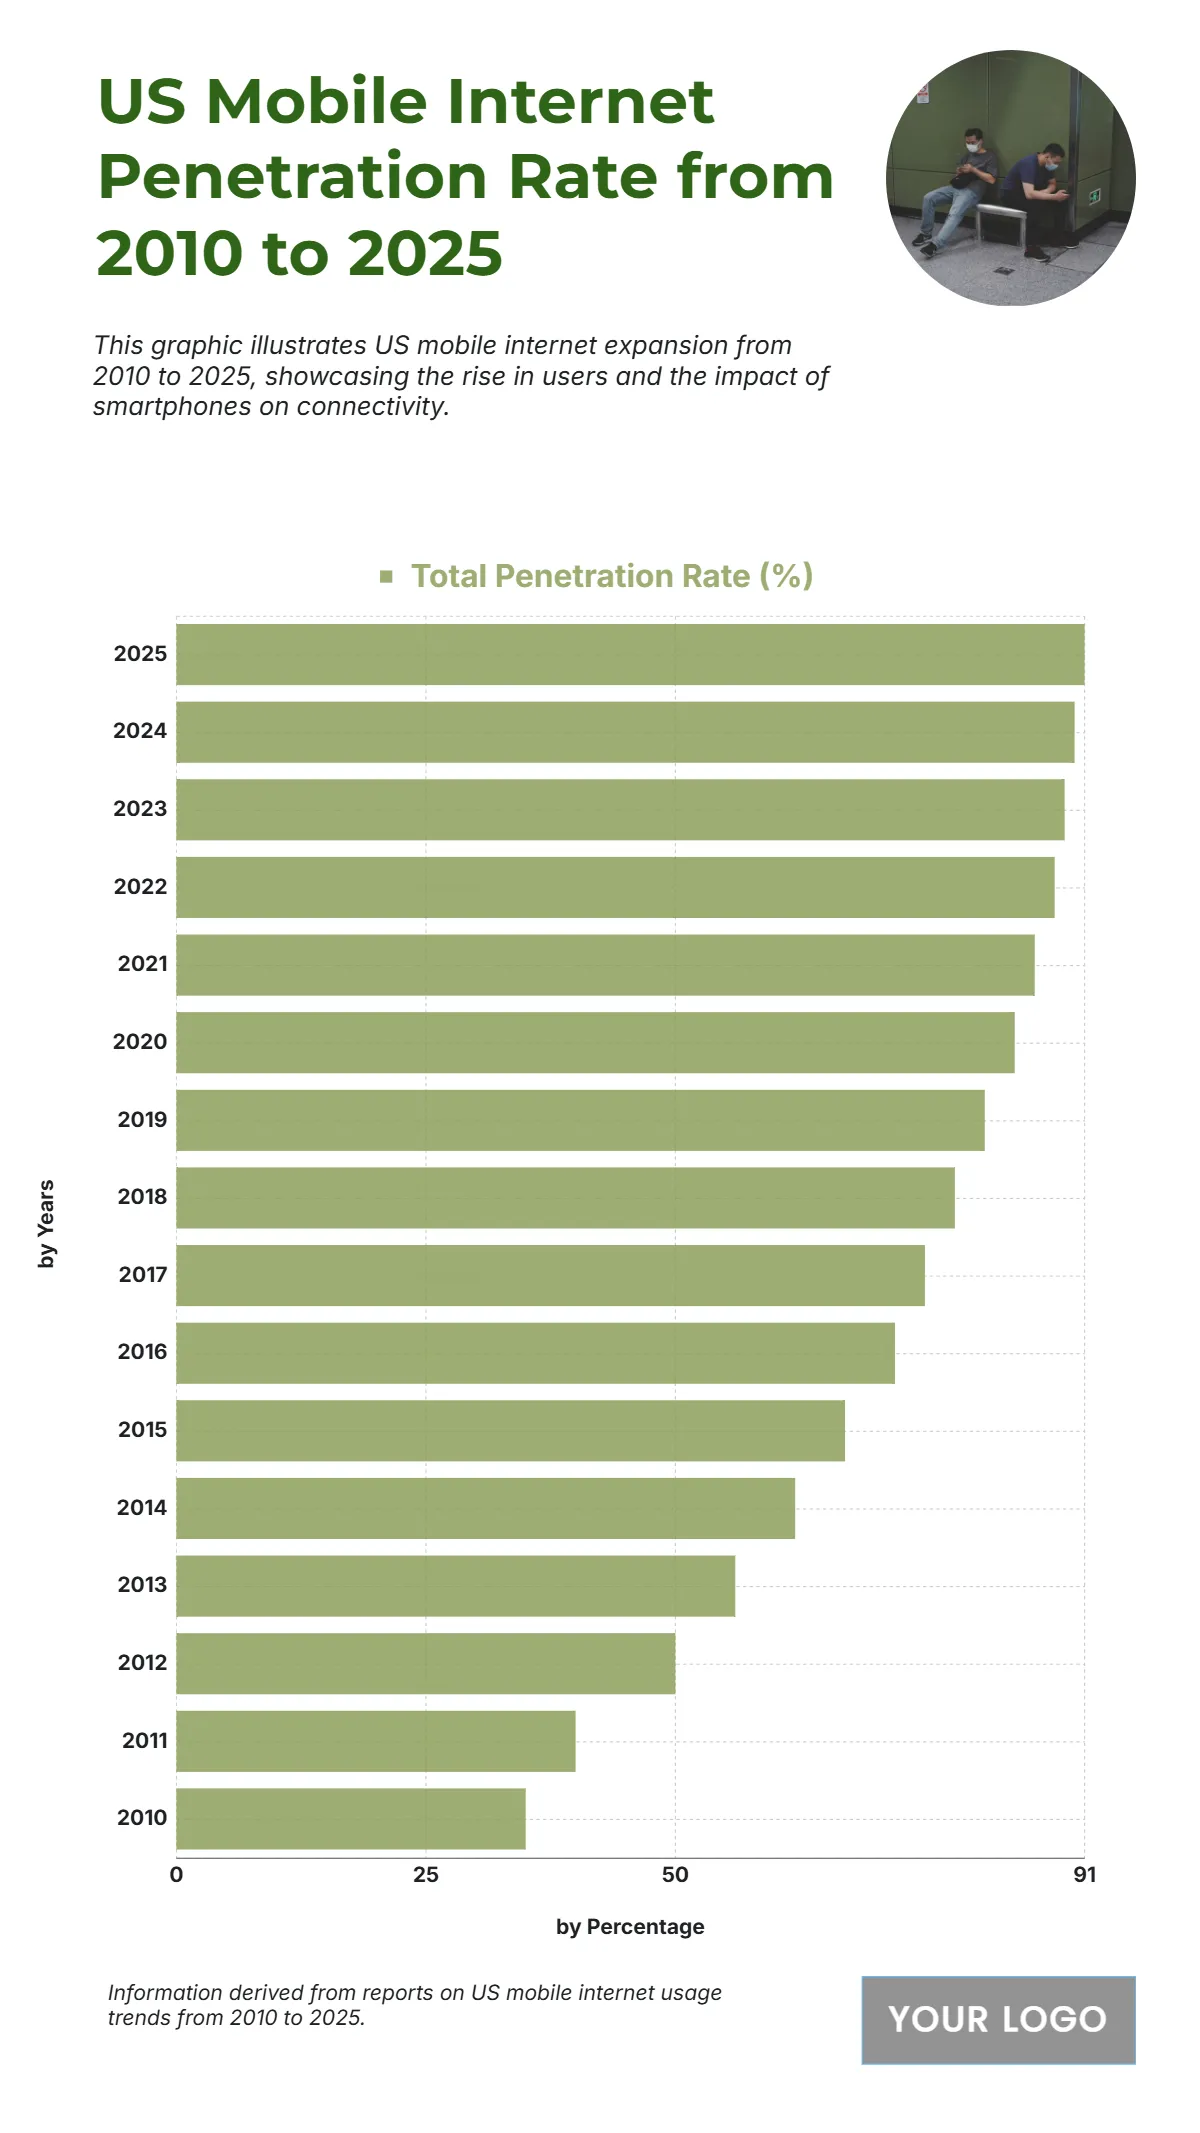
The chart shows a steady and significant rise in US mobile internet penetration from 2010 to 2025, illustrating how smartphones have transformed digital connectivity. In 2010, only 35% of the population had mobile internet access, but this figure consistently climbed each year as mobile technology advanced and data accessibility improved. By 2015, penetration reached 60%, and by 2020, it had expanded further to 78%, reflecting widespread smartphone adoption. The upward trend continued through 2022, with penetration hitting 85%, marking a near-saturation level among users. By 2025 (projected), the penetration rate is expected to peak at 90%, showing how mobile connectivity has become a near-universal experience in the United States. This growth underscores the increasing dependence on mobile devices for communication, commerce, and content consumption, reshaping user behavior and driving digital transformation across industries.
| Labels | Total 2025 Sales (USD billions) (Projected) |
|---|---|
| California | 90 |
| Texas | 50 |
| New York | 38 |
| Florida | 34 |
| Illinois | 27 |
| Pennsylvania | 25 |
| Ohio | 23 |
| Georgia | 22 |
| North Carolina | 21 |
| Michigan | 20 |


