Free US Digital vs Traditional Advertising Spend from 2015 to 2025 Chart
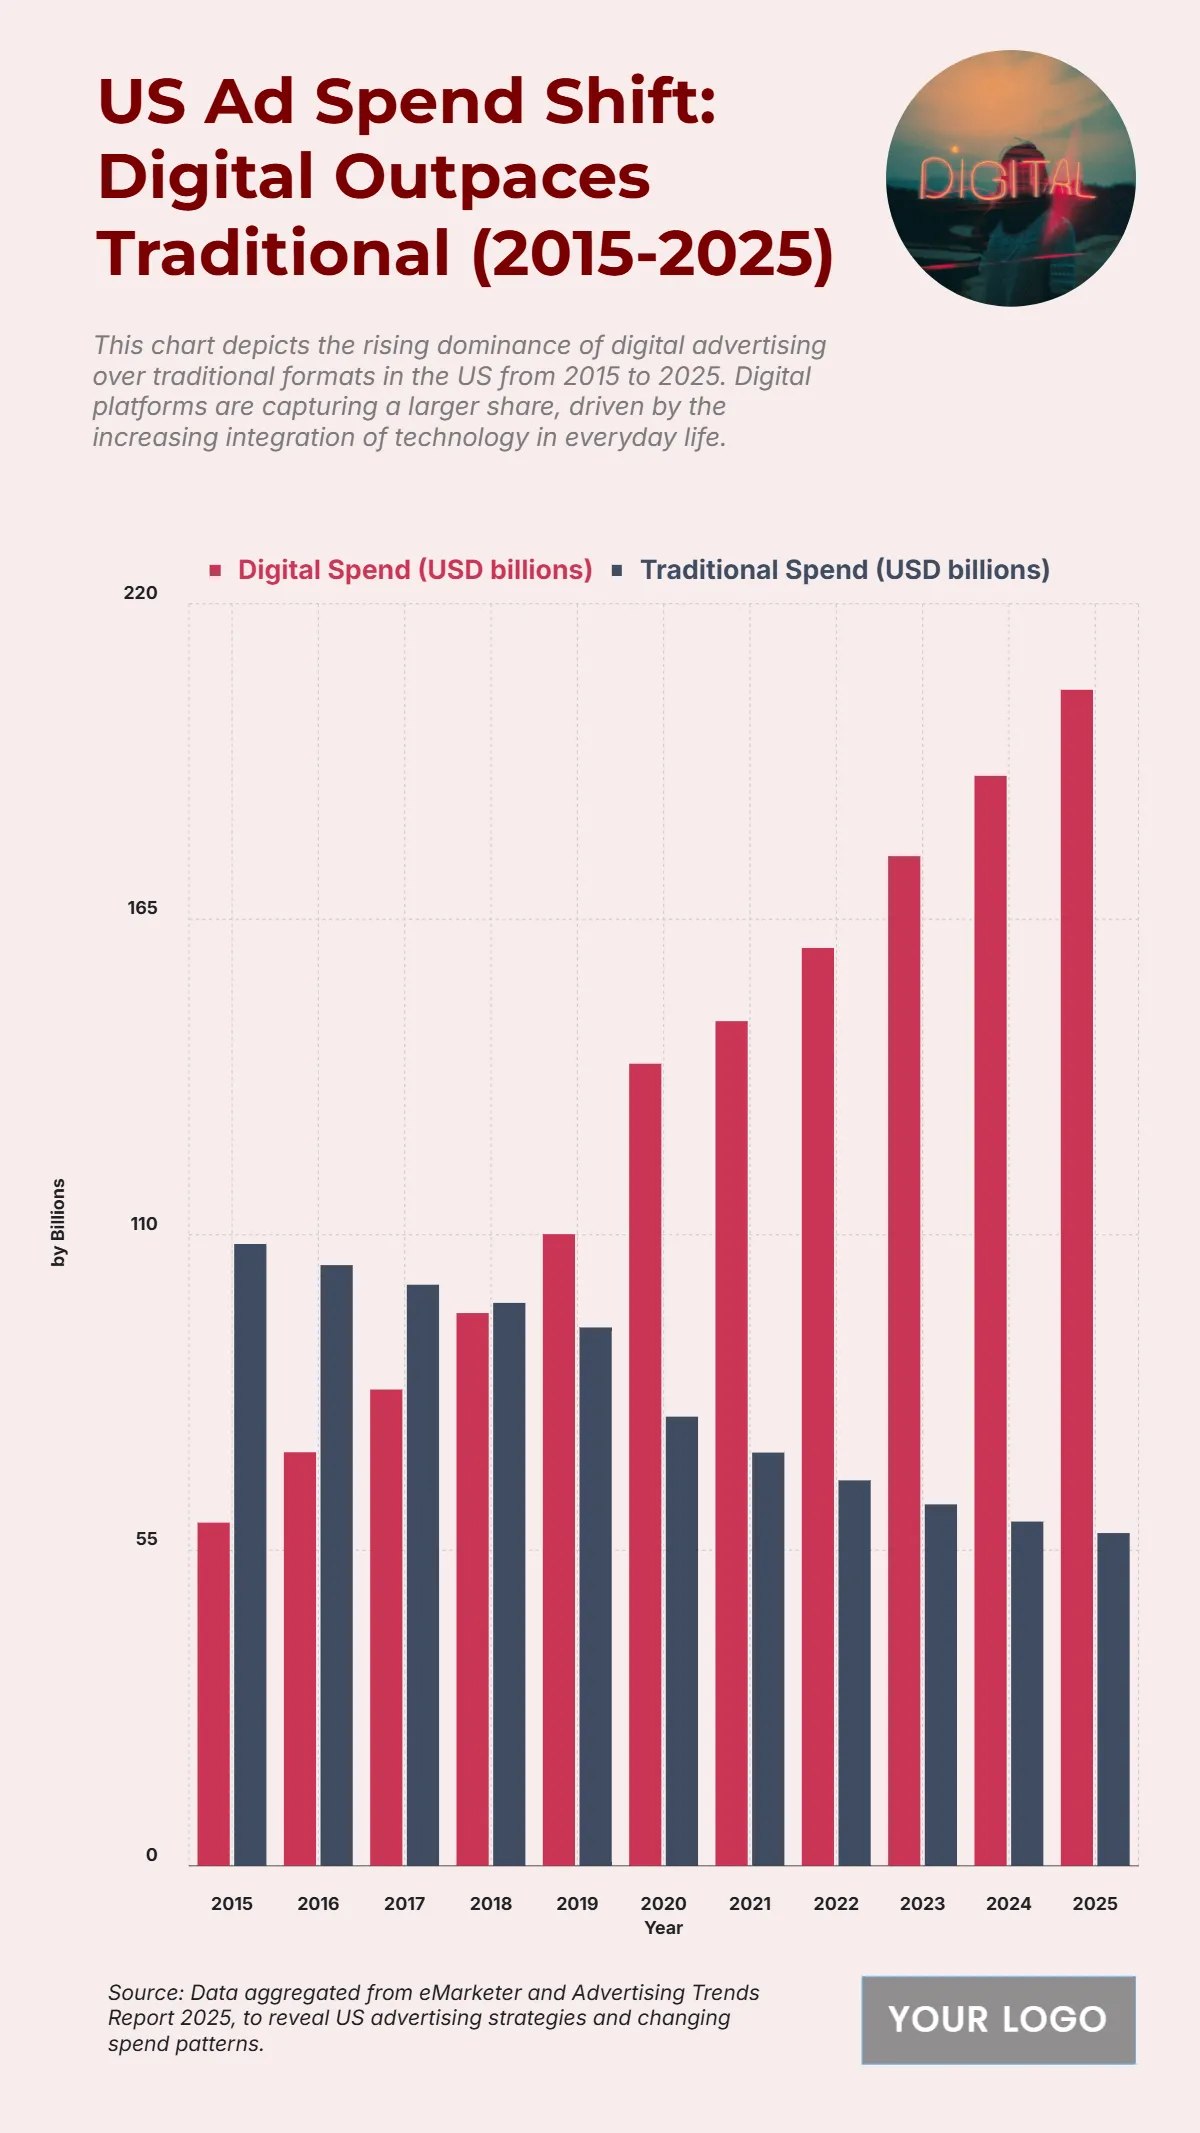
The chart illustrates the ongoing transition from traditional to digital advertising spending in the U.S. between 2015 and 2025, revealing a remarkable shift in marketing investments. Digital ad spend has surged from $59.82 billion in 2015 to a projected $205 billion in 2025, marking a more than 240% increase over the decade. In contrast, traditional ad spend has consistently declined, dropping from $108.39 billion in 2015 to $58 billion by 2025. The crossover point occurred around 2019–2020, when digital expenditure surpassed traditional media. This growth underscores advertisers’ increasing focus on online platforms driven by technology, social media, and mobile engagement. The trend reflects how brands continue to reallocate budgets from TV, print, and radio to digital channels for better targeting and performance analytics. By 2025, digital advertising dominates the market, highlighting the evolution of consumer behavior and the expanding dominance of online ecosystems in the advertising landscape.
| Year | Digital Spend (USD billions) | Traditional Spend (USD billions) |
|---|---|---|
| 2015 | 59.82 | 108.39 |
| 2016 | 72.09 | 104.71 |
| 2017 | 83.02 | 101.29 |
| 2018 | 96.35 | 98.12 |
| 2019 | 110.1 | 93.84 |
| 2020 | 139.82 | 78.29 |
| 2021 | 147.24 | 72.03 |
| 2022 | 160 | 67.19 |
| 2023 | 176 | 63 |
| 2024 | 190 | 60 |
| 2025 | 205 | 58 |


