Free Top 10 U.S. States by Budget Surpluses vs. Deficits (2015-2025)
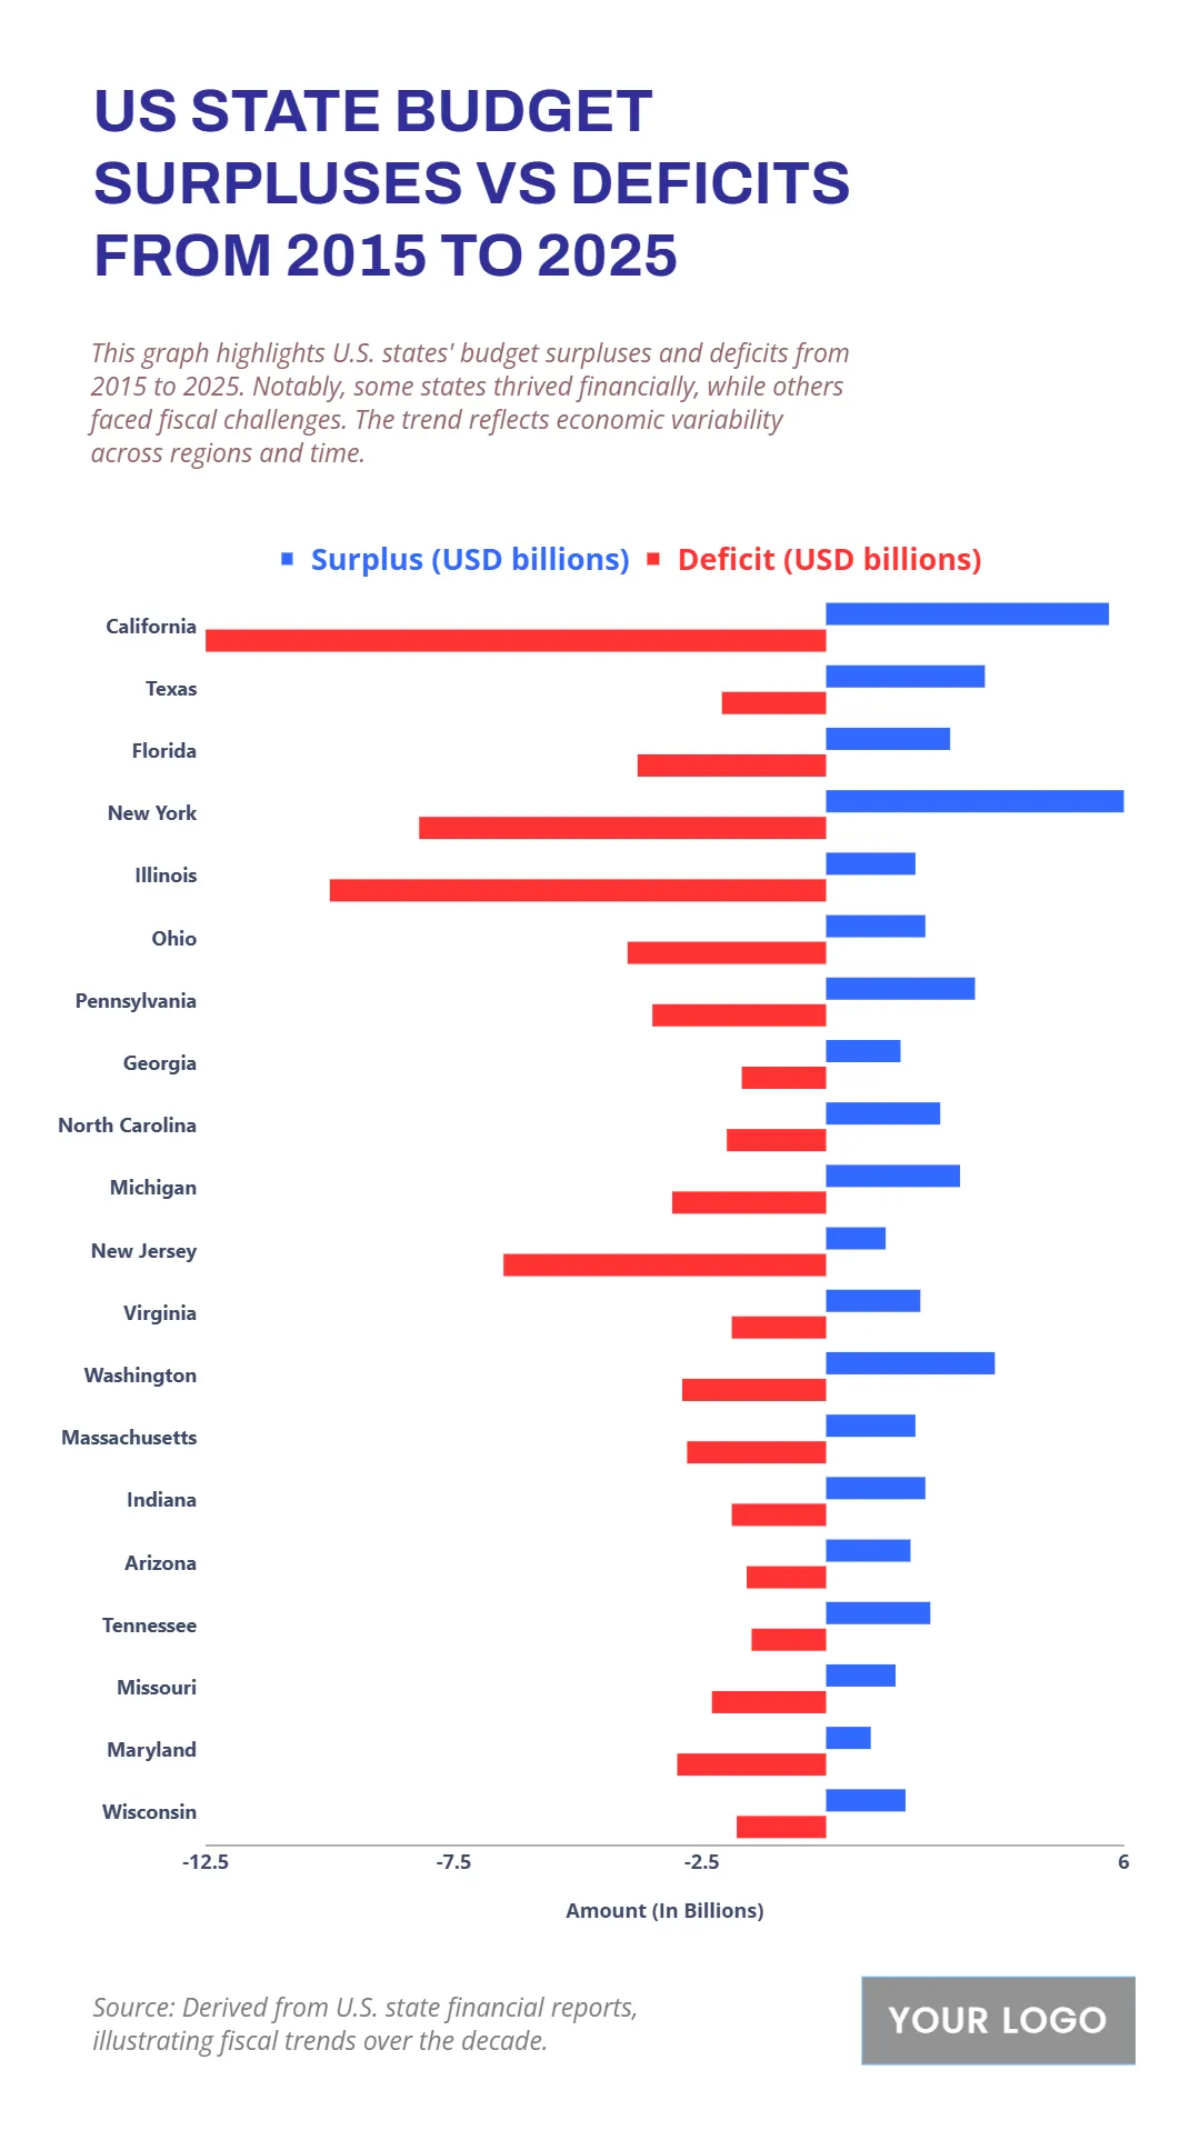
The chart compares state budget surpluses and deficits across major U.S. states between 2015 and 2025, measured in billions of U.S. dollars. California leads with a projected surplus of $5.7 billion, followed by Texas ($3.2 billion), Florida ($2.9 billion), and New York ($2.6 billion), reflecting strong revenue inflows and fiscal management. Other states such as Ohio, Pennsylvania, and North Carolina report smaller surpluses ranging from $1.2 to $1.6 billion.
On the deficit side, Illinois (-$4.0 billion) shows the deepest shortfall, driven by structural budget gaps, while New Jersey (-$3.1 billion) and Michigan (-$2.7 billion) follow with persistent negative balances. States like Massachusetts, Wisconsin, and Virginia hover closer to balance, with deficits of less than $2 billion.
Overall, the chart underscores the fiscal divide between surplus-heavy and deficit-burdened states, highlighting both the strength of states with diversified economies and the struggles of states managing long-term liabilities and spending pressures.
| Labels | Surplus (USD billions) | Deficit (USD billions) |
|---|---|---|
| California | 5.7 | -12.5 |
| Texas | 3.2 | -21 |
| Florida | 2.5 | -3.8 |
| New York | 6 | -8.2 |
| Illinois | 1.8 | -10 |
| Ohio | 2 | -3.5 |
| Pennsylvania | 3 | -3.5 |
| Georgia | 1.5 | -1.7 |
| North Carolina | 2.3 | -3.1 |
| Michigan | 2.7 | -3.1 |
| New Jersey | 1.2 | -6.5 |
| Virginia | 1.9 | -1.9 |
| Washington | 3.4 | -2.9 |
| Massachusetts | 1.8 | -2.8 |
| Indiana | 2 | -1.9 |
| Arizona | 1.7 | -1.6 |
| Tennessee | 2.1 | -1.5 |
| Missouri | 1.4 | -2.3 |
| Maryland | 0.9 | -1.8 |
| Wisconsin | 1.6 | -1.8 |


