Free US Social Media Advertising Trends by Platform from 2020 to 2025 Chart
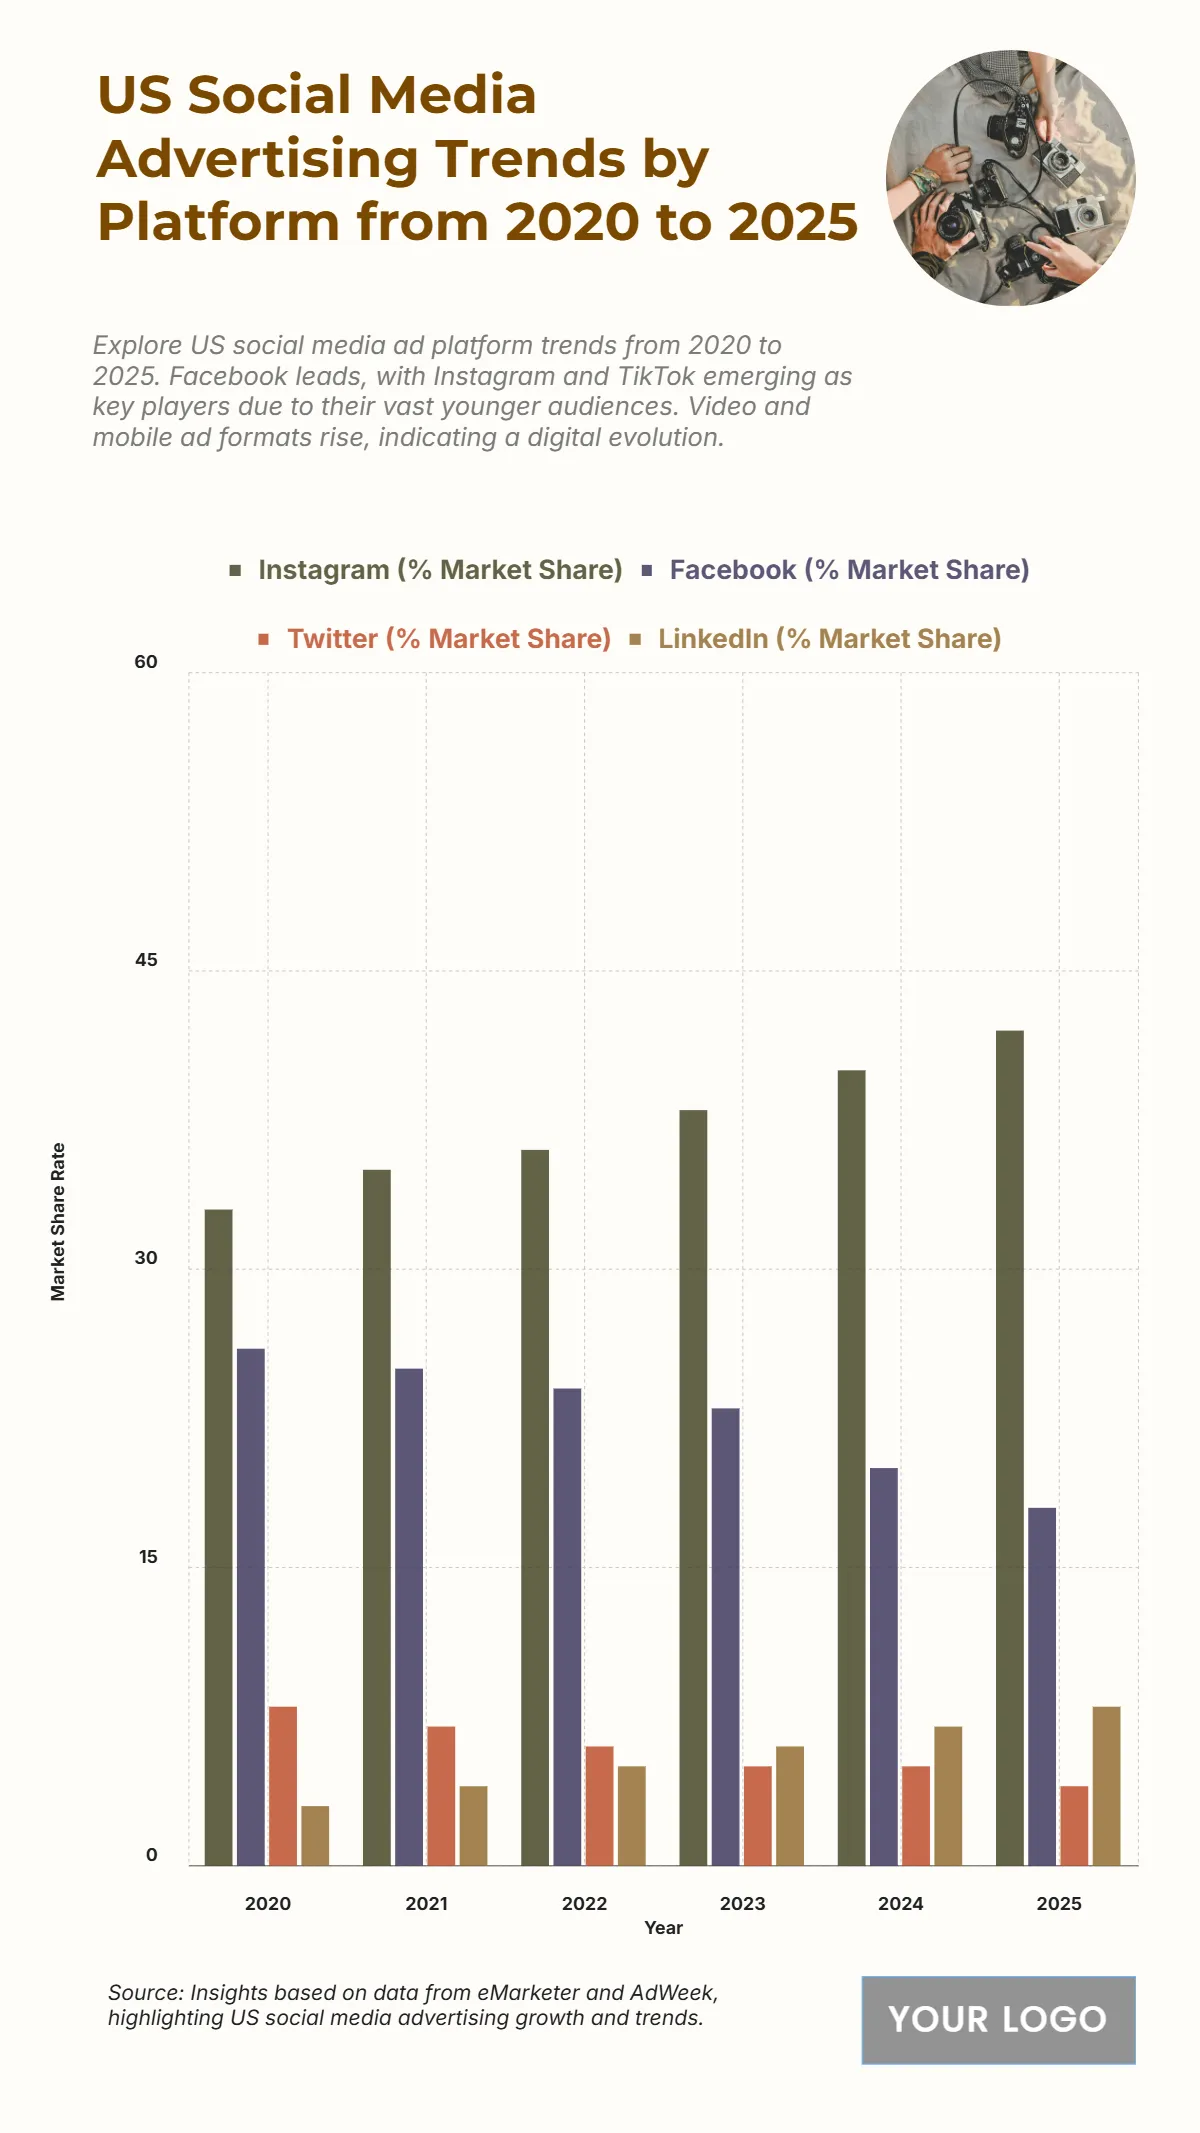
The chart presents a clear overview of social media platform market shares from 2020 to 2025, revealing distinct shifts in advertiser preference and user engagement. Instagram leads with steady growth, increasing its share from 33% in 2020 to 42% in 2025, reflecting its dominance in influencer marketing, visual storytelling, and e-commerce integration. Facebook, once the top platform, declines from 26% in 2020 to 18% in 2025, as younger audiences migrate to newer platforms and advertisers diversify their budgets. Twitter’s market share contracts slightly from 8% to 4%, affected by reduced ad engagement and competition from richer video-based formats. LinkedIn, however, steadily grows from 3% to 8%, driven by its expanding role in B2B marketing and professional branding. Overall, the data underscores a shift toward visually immersive and performance-focused platforms, with Instagram maintaining a leadership position through continuous innovation. The trajectory reflects broader trends in short-form content, social commerce, and targeted ad optimization, redefining the landscape of digital advertising.
| Year | Instagram (%) | Facebook (%) | Twitter (%) | LinkedIn (%) |
|---|---|---|---|---|
| 2020 | 33 | 26 | 8 | 3 |
| 2021 | 35 | 25 | 7 | 4 |
| 2022 | 36 | 24 | 6 | 5 |
| 2023 | 38 | 23 | 5 | 6 |
| 2024 | 40 | 20 | 5 | 7 |
| 2025 | 42 | 18 | 4 | 8 |


