Free Top 20 U.S. States with the Lowest Income Inequality (2020-2025) Chart
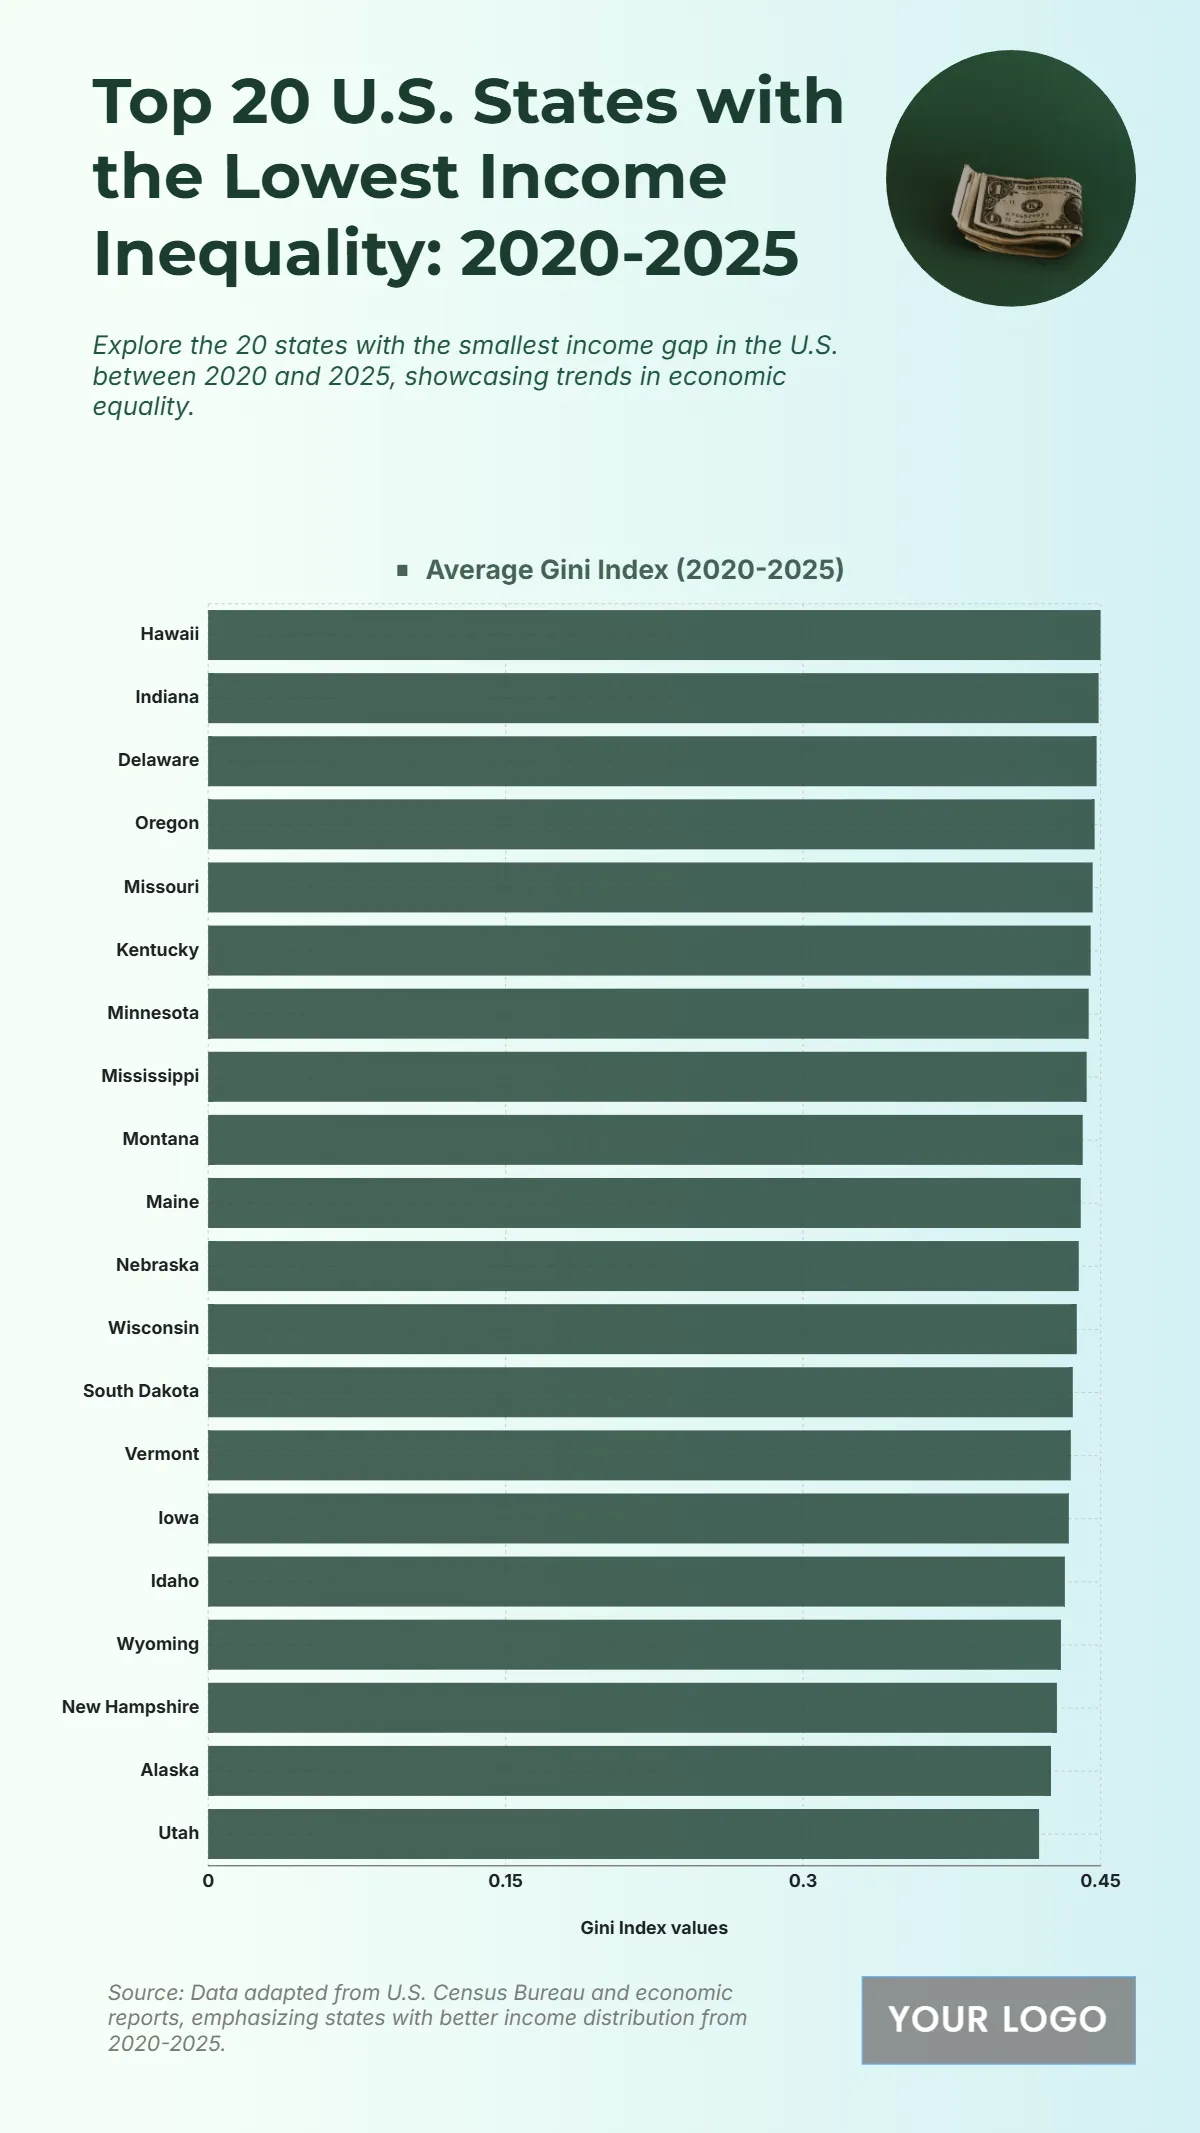
The chart titled “Top 20 U.S. States with the Lowest Income Inequality: 2020–2025” highlights states achieving the most balanced income distribution based on the Gini Index. Hawaii ranks first with an average Gini score of around 0.39, reflecting its strong wage equity and stable cost-of-living balance. Indiana and Delaware follow closely with indices near 0.40, while Oregon, Missouri, and Kentucky also maintain similarly equitable ranges. Midwestern and Mountain states such as Nebraska, Iowa, Wyoming, and Idaho display moderate values near 0.41, indicating steady income consistency across households. Utah and Alaska record the lowest inequality levels in the western region, both averaging around 0.42. Overall, the chart demonstrates that smaller, less urbanized states often sustain narrower income gaps, suggesting strong middle-income representation and consistent wage structures between 2020 and 2025.
| Labels |
Average Gini Index (2020-2025) |
| Hawaii | 0.45 |
| Indiana | 0.449 |
| Delaware | 0.448 |
| Oregon | 0.447 |
| Missouri | 0.446 |
| Kentucky | 0.445 |
| Minnesota | 0.444 |
| Mississippi | 0.443 |
| Montana | 0.441 |
| Maine | 0.44 |
| Nebraska | 0.439 |
| Wisconsin | 0.438 |
| South Dakota | 0.436 |
| Vermont | 0.435 |
| Iowa | 0.434 |
| Idaho | 0.432 |
| Wyoming | 0.43 |
| New Hampshire | 0.428 |
| Alaska | 0.425 |
| Utah | 0.419 |


