Free US Political Campaign Advertising Media Mix from 2020 to 2025 Chart
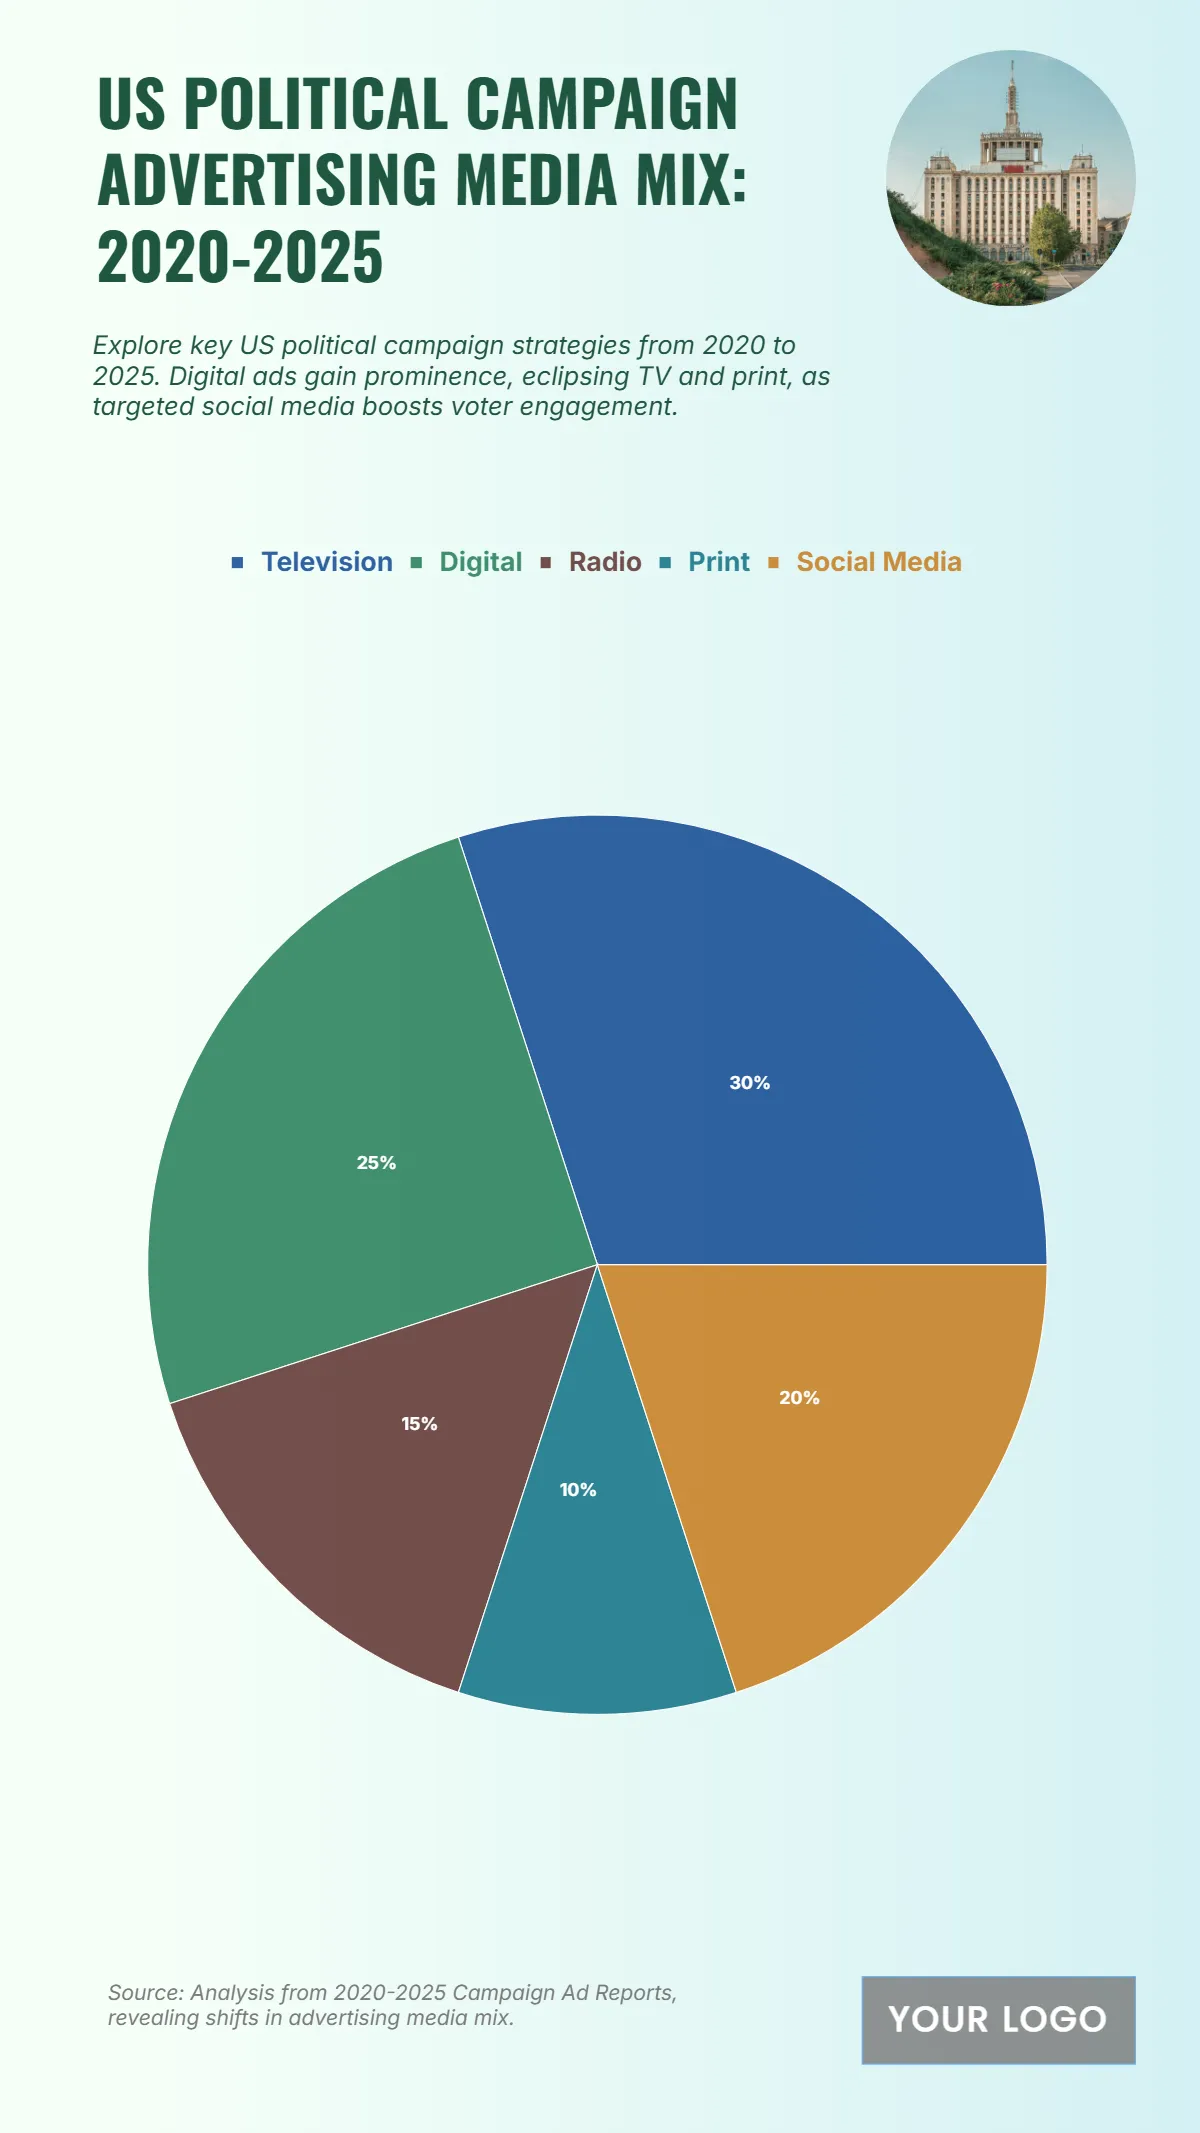
The chart highlights the evolving US political campaign advertising media mix from 2020 to 2025, showcasing the diversification of platforms used to reach voters. Television continues to hold the largest share at 30%, underscoring its enduring influence in national campaigns. However, digital advertising follows closely at 25%, reflecting the rapid shift toward online engagement and targeted voter outreach. Social media accounts for 20%, emphasizing the growing power of platforms like Facebook, YouTube, and X (Twitter) in shaping political discourse and mobilizing voters. Meanwhile, radio contributes 15%, maintaining its relevance in regional and community-based messaging, while print media makes up the remaining 10%, marking a steady decline as campaigns prioritize digital efficiency. Overall, the data demonstrates a clear movement toward digital-first strategies, where online and social platforms are becoming as vital as traditional broadcast methods in driving political communication and voter influence.
| Labels | 2020–2025 Expenditure (in millions) |
|---|---|
| Television | 30 |
| Digital | 25 |
| Radio | 15 |
| 10 | |
| Social Media | 20 |


