Free US Retail Marketing Expenditure by Quarter from 2015 to 2025
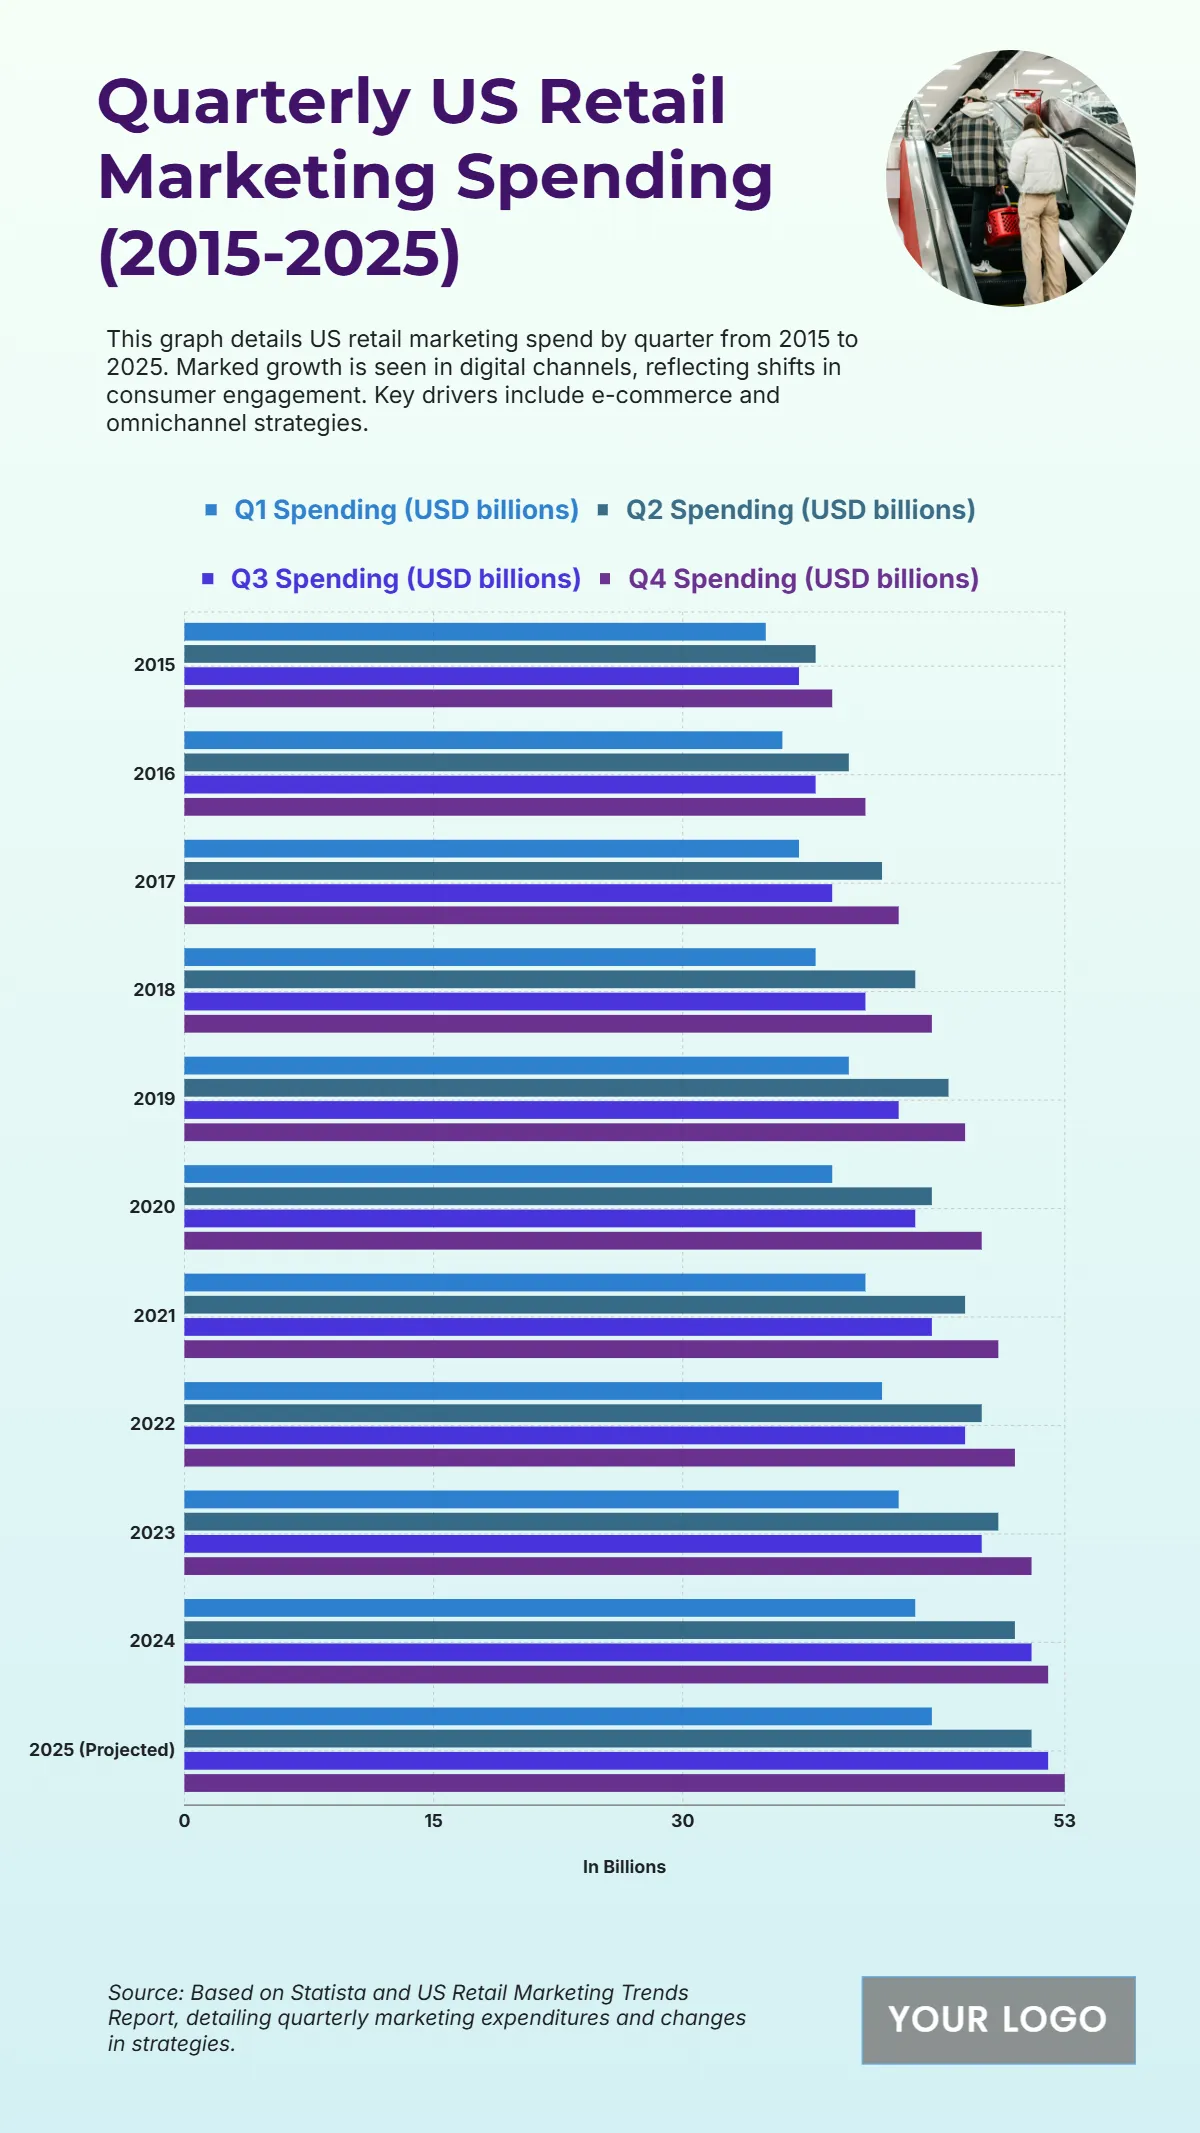
The chart illustrates U.S. retail marketing spending by quarter from 2015 to 2025, emphasizing consistent growth driven by e-commerce expansion and digital transformation. Spending across all four quarters—Q1 to Q4—increased steadily over the decade, with notable acceleration after 2020 due to online retail surges and digital ad innovations. In 2015, quarterly marketing expenditures averaged around USD 25–30 billion, reflecting traditional retail strategies focused on seasonal campaigns. By 2020, spending had risen to approximately USD 40 billion per quarter, as brands adopted omnichannel approaches and social media promotions. The projected 2025 figures exceed USD 50 billion per quarter, marking a decade-high milestone in retail advertising investment. Q4 consistently records the highest spending, driven by holiday campaigns and year-end promotions, while Q1 remains the lowest, often reflecting post-holiday market slowdowns. This upward trajectory highlights a broader shift toward data-driven and digital-first retail marketing, underscoring retailers’ commitment to enhancing consumer engagement and adapting to evolving shopping behaviors from 2015 through 2025.
| Labels | Q1 Spending (USD billions) | Q2 Spending (USD billions) | Q3 Spending (USD billions) |
Q4 Spending (USD billions) |
| 2015 | 35 | 38 | 37 | 39 |
| 2016 | 36 | 40 | 38 | 41 |
| 2017 | 37 | 42 | 39 | 43 |
| 2018 | 38 | 44 | 41 | 45 |
| 2019 | 40 | 46 | 43 | 47 |
| 2020 | 39 | 45 | 44 | 48 |
| 2021 | 41 | 47 | 45 | 49 |
| 2022 | 42 | 48 | 47 | 50 |
| 2023 | 43 | 49 | 48 | 51 |
| 2024 | 44 | 50 | 51 | 52 |
| 2025 (Projected) | 45 | 51 | 52 | 53 |


